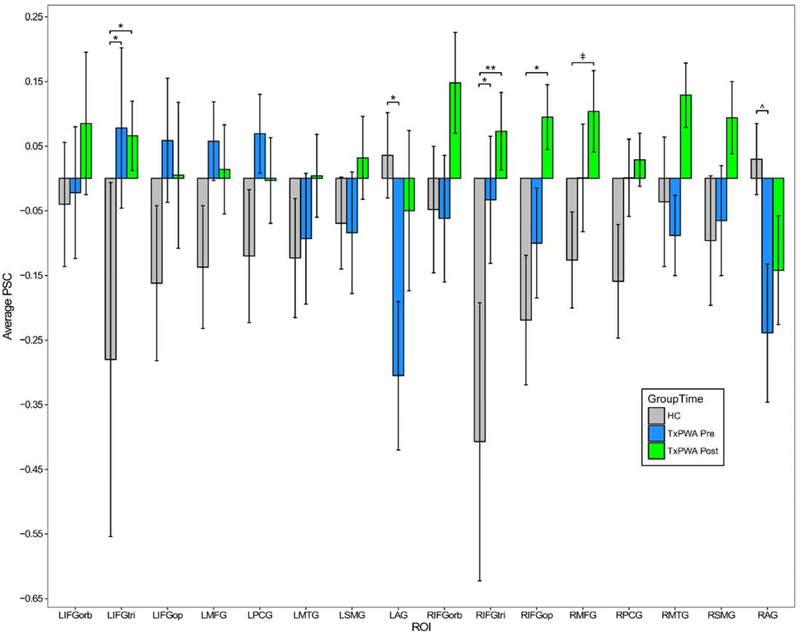
Figure 3.
Average activation by ROI in healthy controls (HC) and treated patients (TxPWA) before and after treatment. Error bars reflect standard error. Significance indicators are based on post hoc EM means tests. **p < .001; *p < .05; ^p = .074; ǂp = .089.
Abbreviations: HC: healthy controls; TxPWA: treated patients; PSC: percent signal change (pictures > fixation); L: left; R: right; IFGorb: inferior frontal gyrus pars orbitalis; IFGtri: IFG pars triangularis; IFGop: IFG pars opercularis; MFG: middle frontal gyrus; PCG: precentral gyrus; MTG: middle temporal gyrus; SMG: supramarginal gyrus; AG: angular gyrus

