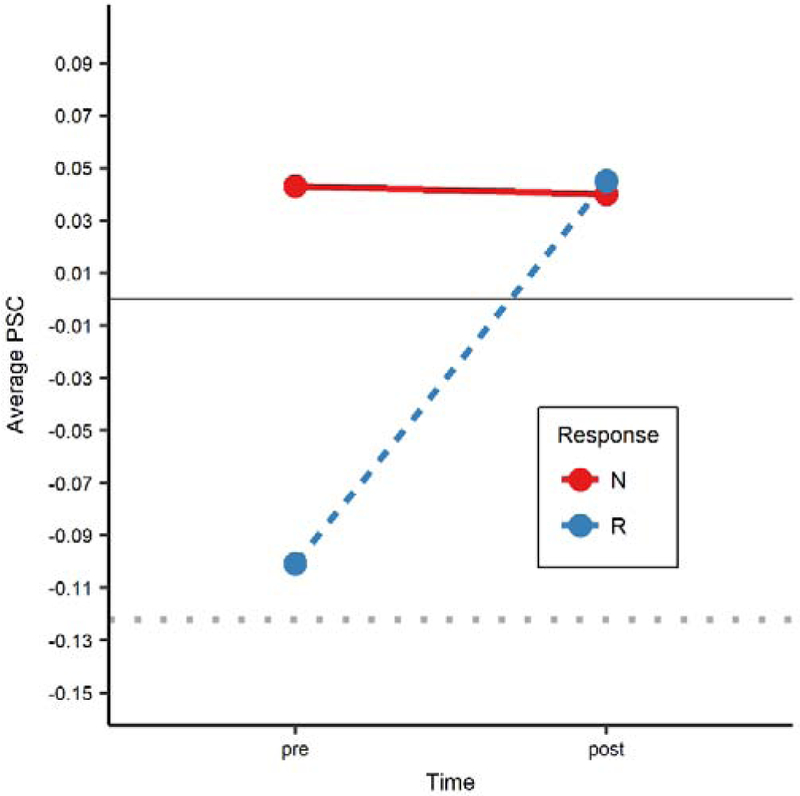
Figure 6.

Average activation across all ROIs at pre- and post-treatment in responders (blue dots/dashed line) and non-responders (red dots/solid line). Responders had a significant increase in activation (p < .001), while nonresponders showed no significant change. For reference, average activation for healthy controls (HC) is plotted as a dotted gray line.
N: nonresponders; R: responders
