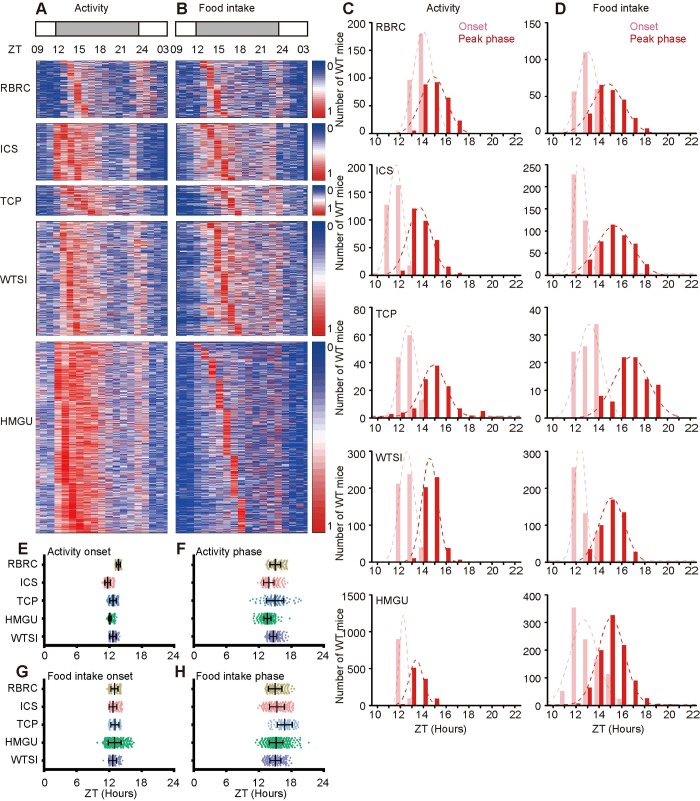
Fig 2. The distribution of the onset time and peak phase of activity and food intake from IC data from five IMPC centres.
(A, B) Heat map showing the consistent trend of the onset, peak phase and amplitude of activity (A) and food intake (B) recorded by IC of more than 2000 C57BL/6N mice across the five IMPC centres. Mice were ordered according to their evening peak phases. 1 (red) represents the strongest; 0 (blue) represents the weakest. Zeitgeber time (ZT), ZT 0: light on, ZT12: light off. (C, D) The distribution of the onset and peak phase of activity (C) and food intake (D) from the five centres identified by SyncScreener (pink: onset; red: peak phase). Also see S1 Fig with visual assessment. (E-H) The varied range of onset and peak phase of activity and food intake from the five centres identified by SyncScreener.

