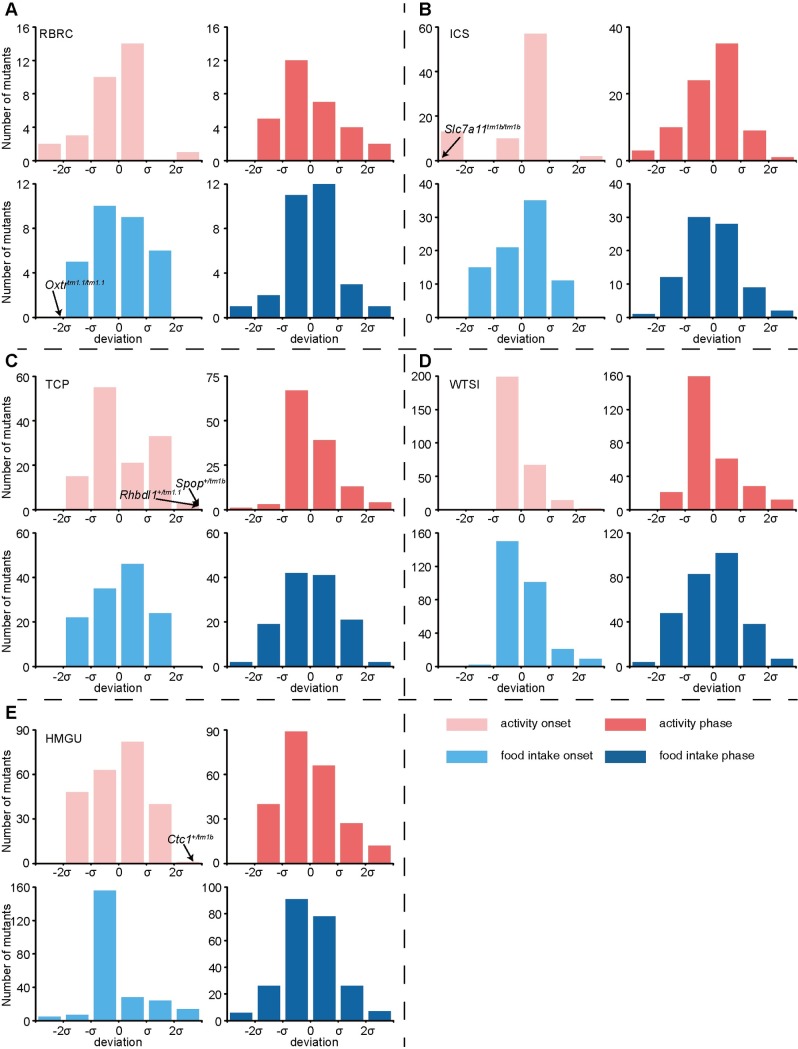
Fig 4. Systematic identification of the onset and peak phase phenotypes.
(A-E) Distribution of the number of mutant lines with onset or peak phase deviated from wild-type mice at ±0, ±σ, and ±2σ. IC data from RBRC (A), ICS (B), TCP (C), WTSI (D) and HMGU (E) are presented separately. Mutants were defined as outliers when the parameters deviated from the mean greater than 2σ. Five candidates meeting the secondary criteria are labelled by arrows.

