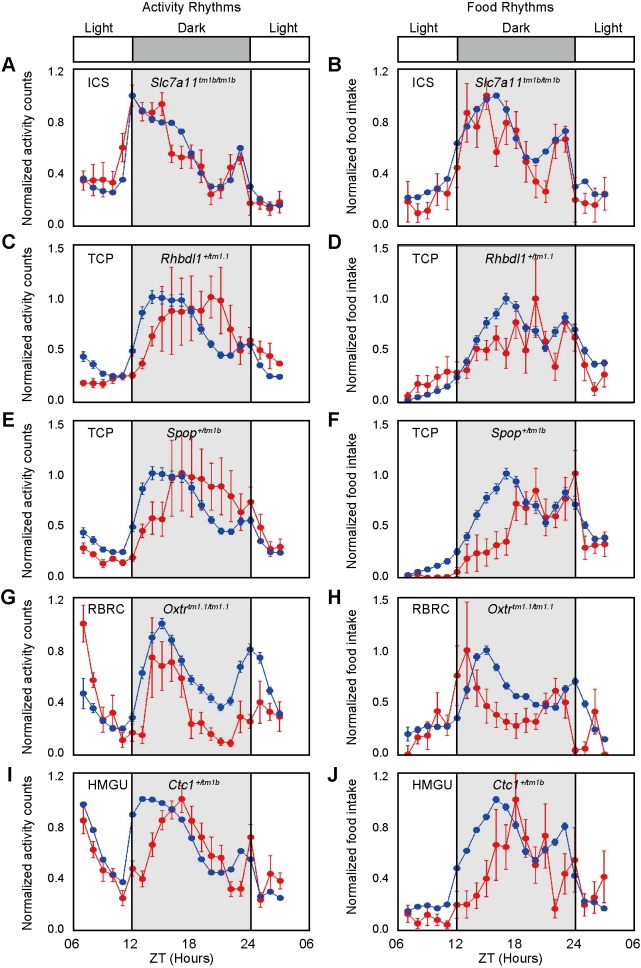
Fig 5. Analysis of onset and peak phase phenotypes of mice from identified mutant lines.
Profiles of oscillating activity (A, C, E, G, I) and food intake over time (B, D, F, H, J) for Slc7a11 (A, B), Rhbdl1 (C, D), Spop (E, F), Oxtr (G, H) and Ctc1 (I, J) mutant mice. Blue and red lines represent the wild-type and mutant mice in the same centre, respectively. Data are normalized and presented as the mean value ± SEM (n = 7–8 for each genotype). The time of day is indicated in hours, and the dark period is indicated by shading.

