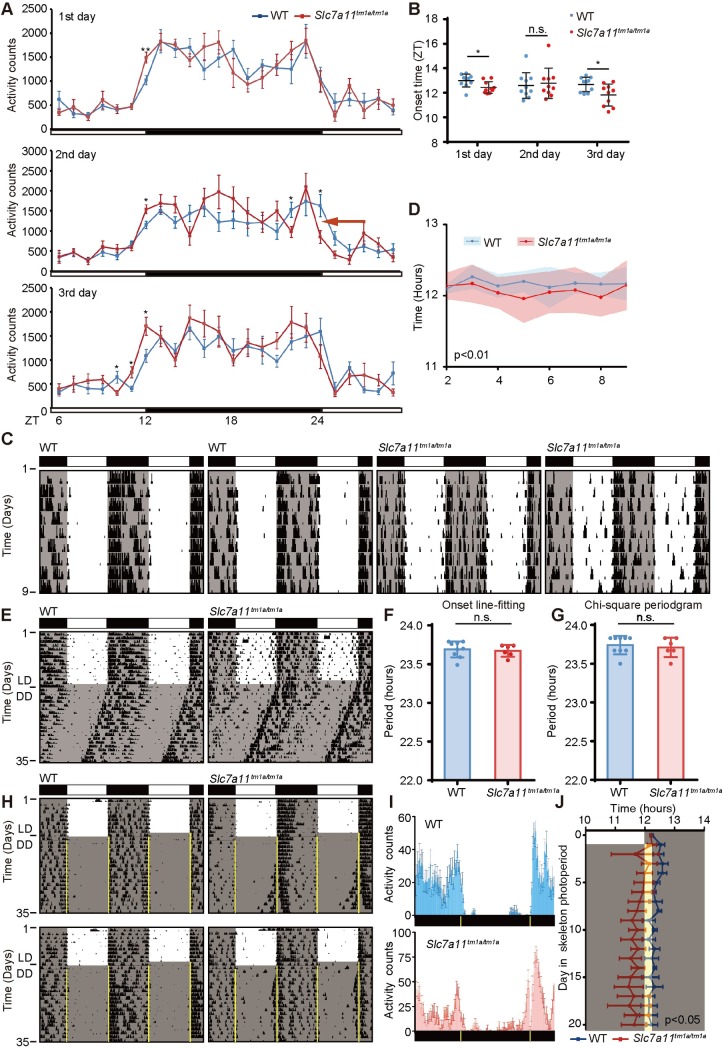
Fig 6. Validation of the role of Slc7a11 in circadian entrainment of activity onset.
(A) The activity profiles of Slc7a11tm1a/tm1a and wildtype littermates under a 12hr light/12hr dark cycle using CLAMS (IC data). Rhythms were plotted over a 24 hr time frame as the mean ± SEM for three days (n = 10 for each genotype). (B) The onset of activity was shown as mean ± SEM. The Student t-test is used to determine the significance, *p < 0.05, **p < 0.01. (C) The representative actograms for analyzing the onset times under LD cycles in wild-type mice (left) and Slc7a11tm1a/tm1a mice (right). (D) The onset times of activity were measured by Clocklab analysis. Data was shown as means with SEM (n = 8 for WT, n = 6 for Slc7a11tm1a/tm1a) for 8 continuous days. The pink and blue shadow indicates the range of onset times for the Slc7a11tm1a/tm1a mice and their wild-type littermates. (E) The representative actograms of wheel-running activity for period determination. The mice were first entrained to an LD cycle for 14 days and then released in DD for approximately 3 weeks. Black shading indicates the time when lights were off, and the white box indicates the time when lights were on. (F-G) Period was determined by line fitting of activity onset (F) and chi-square periodogram (G) from day 11 to day 21 in DD. (H-I) Representative actograms (H) and activity profiles (I) of wheel-running activity for wild-type mice and Slc7a11tm1a/tm1a mice under skeleton photoperiod with 15-min entraining arms for an 20-d period (n = 6 for each genotype). Each row represents a single day. The mice were first entrained to a LD cycle for 10 days and then released to the skeleton photoperiod with 15-min light arms from clock time 07:45 to 08:00 and again from clock time 20:00 to 20:15 (ZT0, clock time 08:00). The black and yellow bars in I (below) represent periods of darkness and light, respectively. (J) The onset times of activity under skeleton photoperiod were measured by Clocklab analysis. Blue: WT; Red: Slc7a11tm1a/tm1a. Data was shown as means with SEM. Two-way ANOVA was employed to analyze statistical significance.

