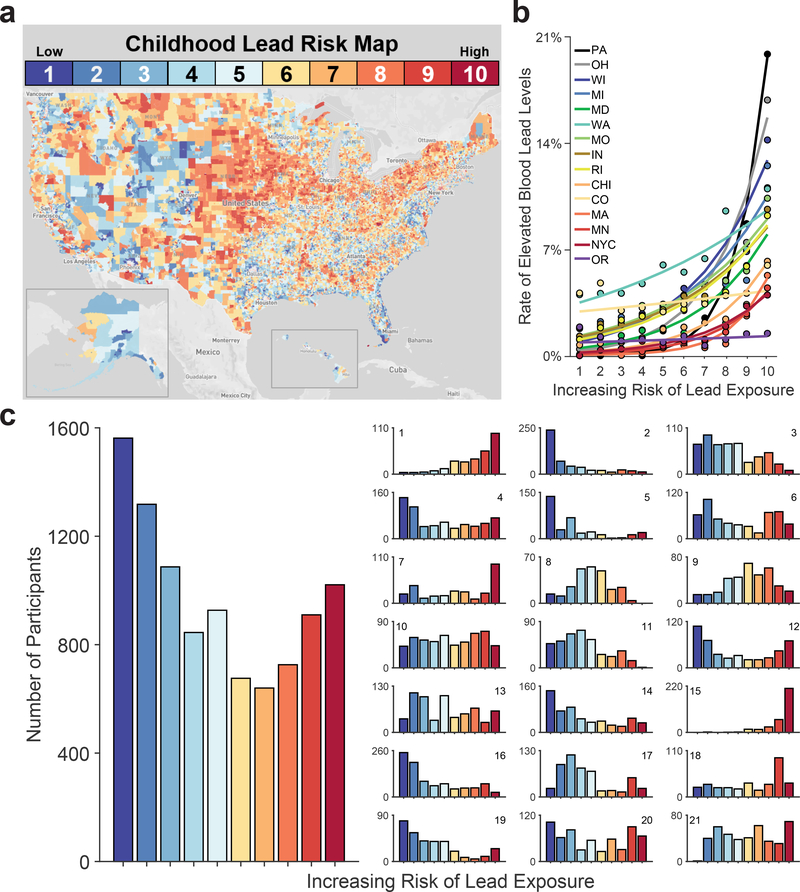
Figure 1. Lead-Exposure Risk Scores Predict Elevated-Blood-Lead-Level Rates at the Census Tract Level.
(a) The estimated risk of lead exposure by U.S. census tract. Lower values reflect lesser risk. Map by Rad Cunningham and Sarah Frostenson.27 (b) Rates of elevated blood lead levels globally increased with estimates of lead risk across 13 states and 2 cities. Analysis employed generalized linear-mixed effects models, which tested the statistical significance of coefficients against a t-distribution. (c) Number of children in the ABCD cohort by lead-risk score. Geocoded data were based on current primary residential addresses provided by participants’ caregivers. The smaller subpanels represent individual ABCD study sites. Per the terms of the data release, sites are arbitrarily numbered. Site number is shown in the upper right or left of each subpanel. Alphabetically, the ABCD study-site cities are Ann Arbor, Michigan; Baltimore, Maryland; Boulder, Colorado; Burlington, Vermont; Charleston, South Carolina; Gainesville, Florida; Los Angeles, California; Menlo Park, California; Miami, Florida; Milwaukee, Wisconsin; Minneapolis, Minnesota; New Haven, Connecticut; Pittsburgh, Pennsylvania; Portland, Oregon; Richmond, Virginia; Rochester, New York; Salt Lake City, Utah; San Diego, California; St. Louis, Missouri; and Tulsa, Oklahoma. ABCD study sites are present in 8 of the 13 states including in the analysis in Panel B.

