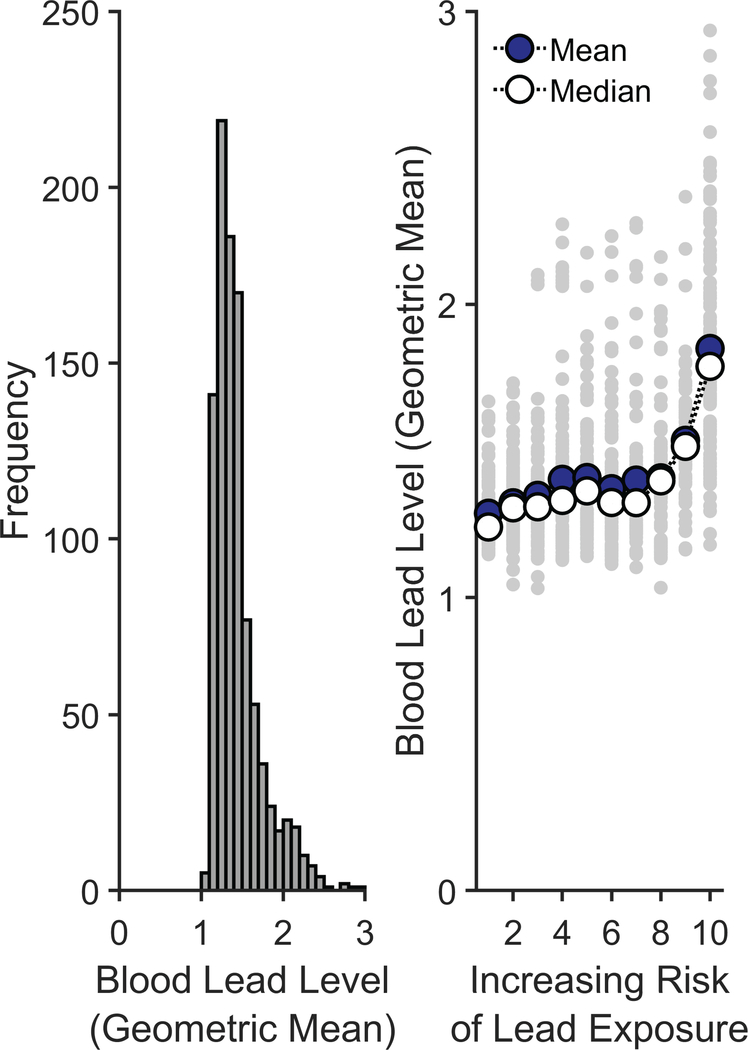
Extended Data Fig. 7. Lead exposure risk scores predict Maryland’s blood lead levels at the census-tract level.
Left: Distribution of the census-tract-level geometric means of blood lead levels in Maryland, collapsed across the years of 2010 to 2014. Right: Geometric mean blood lead levels as a function of the estimated risk of lead exposure. The smaller gray data points represent individual census tracts. Two measures of central tendency are provided: The larger darker data points represent the means at each risk level, while the larger open data points represent the medians at each risk level. Analysis employed a Spearman’s rank-order correlation.

