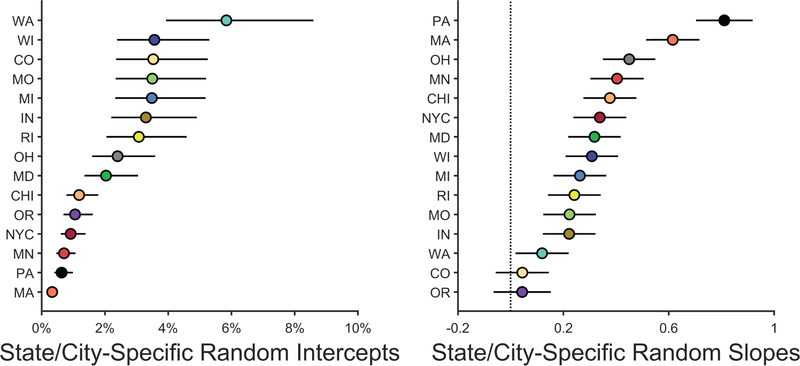
Extended Data Fig. 1. The distribution of random coefficients for each geographic region.
Each data point represents the random intercept (left) or slope (right) for each state/city (i.e., fixed effect coefficient + random effects deviation). The lines surrounding the data points represent the 95% confidence interval of the coefficient. Aside from Oregon and Colorado (for which the 95% confidence intervals included 0), there were significant increases in elevated-blood-lead-level rates with increasing lead-risk scores for each state/city (right). Analysis employed generalized linear-mixed effects models, which tested the statistical significance of coefficients against a t-distribution.

