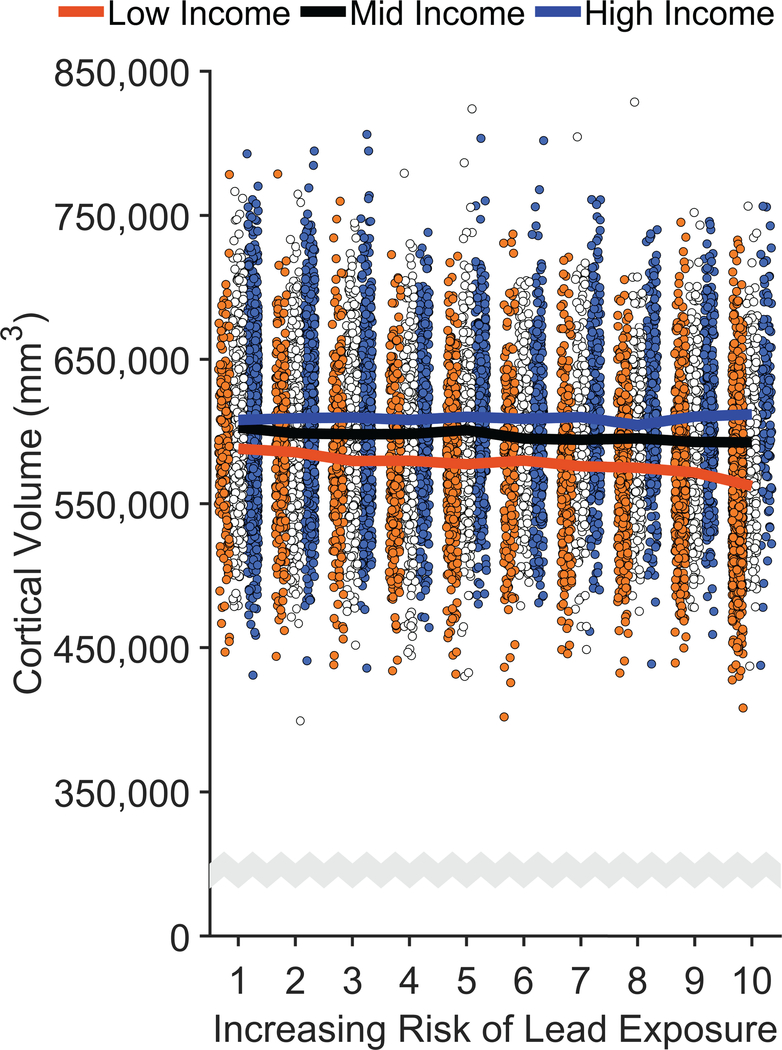
Extended Data Fig. 4. Negative associations of increased risk of lead exposure are greater for children from lower-income families.
Whole-brain cortical volume declined most steeply with increasing risk of environmental lead exposure in children of low-income parents. The data reflect individual participants. Solid lines represent means of the marginal fitted values of the model. Analysis employed linear mixed-effects models, which tested the statistical significance of coefficients against a t-distribution. Age, sex, parental education, and race/ethnicity were included as covariates in this analysis. The scale of the ordinate differs from that in Figure 3b.

