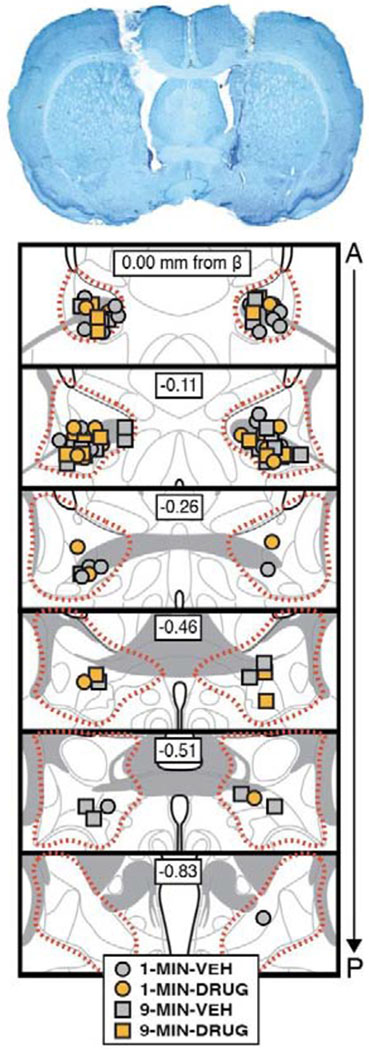
Figure 6. Bilateral cannula placements in the BNST.
Representative photomicrograph of a thionin-stained coronal section (40 μm) depicting bilateral cannula tracts and injector tips in the BNST (top image). Bottom image shows the positions of injector tips for each animal for each group included in the final analyses of the experiment (approximate borders of the BNST are outline by the dotted red line). 1-MIN-VEH (n = 13); 1-MIN-DRUG (n = 11); 9-MIN-VEH (n = 15); 9-MIN-DRUG (n = 9).

