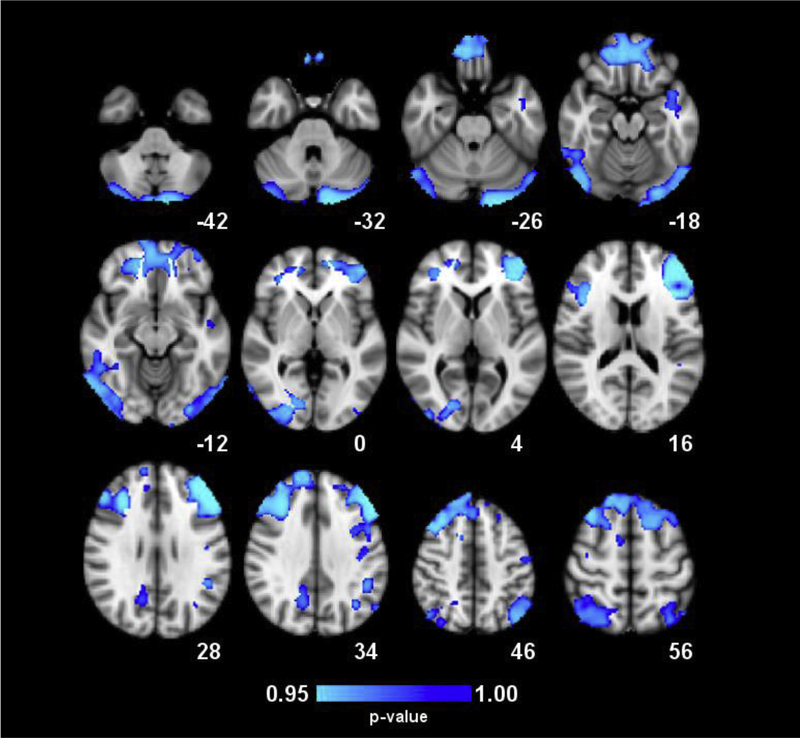
Figure 1.
Whole-brain maps of significant differences in gray matter volume (GMV) between groups. Regions in blue denote lower GMV in COC+ relative to COC− participants. Results were generated through permutation testing of voxel cluster statistics with cluster-wise p < .05 using TFCE to correct for multiple comparisons. Clusters are described in Table 2. Statistical results are overlaid on the MNI152 2mm standard-space T1-weighted structural template. The numbers below the images indicate the Z coordinate for each axial slice. Images are in radiological orientation (left = right, right = left).

