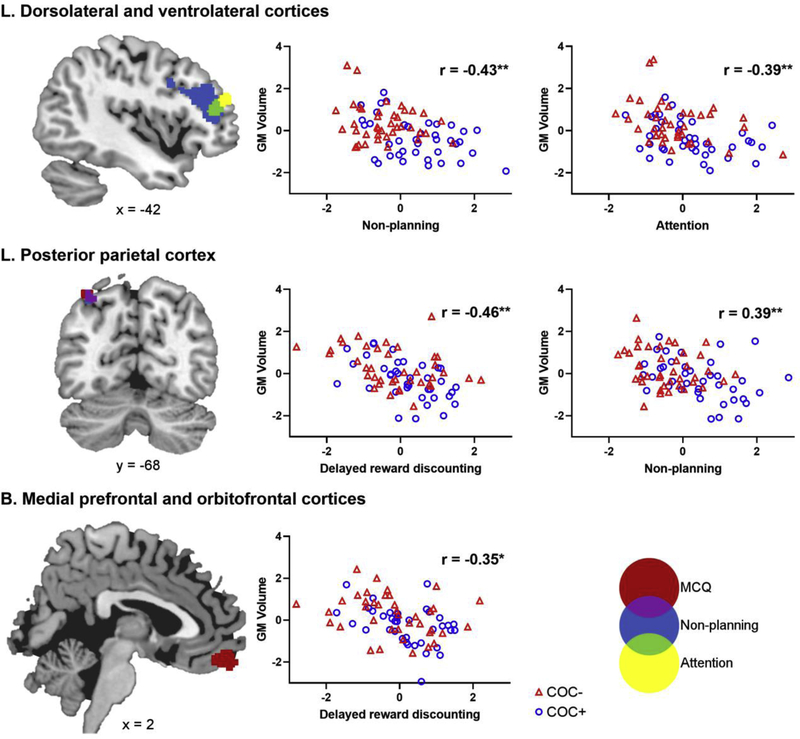
Figure 2.
Images on the left show clusters in which gray matter volume (GMV) correlated with impulsivity measures. Voxelwise correlations were conducted using permutation testing with TFCE at p < .05 to correct for multiple comparisons. Each impulsivity measure and their overlap is coded with a different color. Clusters are described in Table 3. Statistical results are overlaid on the MNI152 2mm standard-space T1-weighted structural template. The numbers below the images indicate the appropriate coordinate for each slice. Images are in radiological orientation (left = right, right = left). Scatterplots on the right show the correlation between GMV and impulsivity within each significant cluster. The standardized residuals from the partial correlations controlling for age and other substance use are plotted. The r-values represent the partial correlation coefficients. *p<.005, **p<.001.

