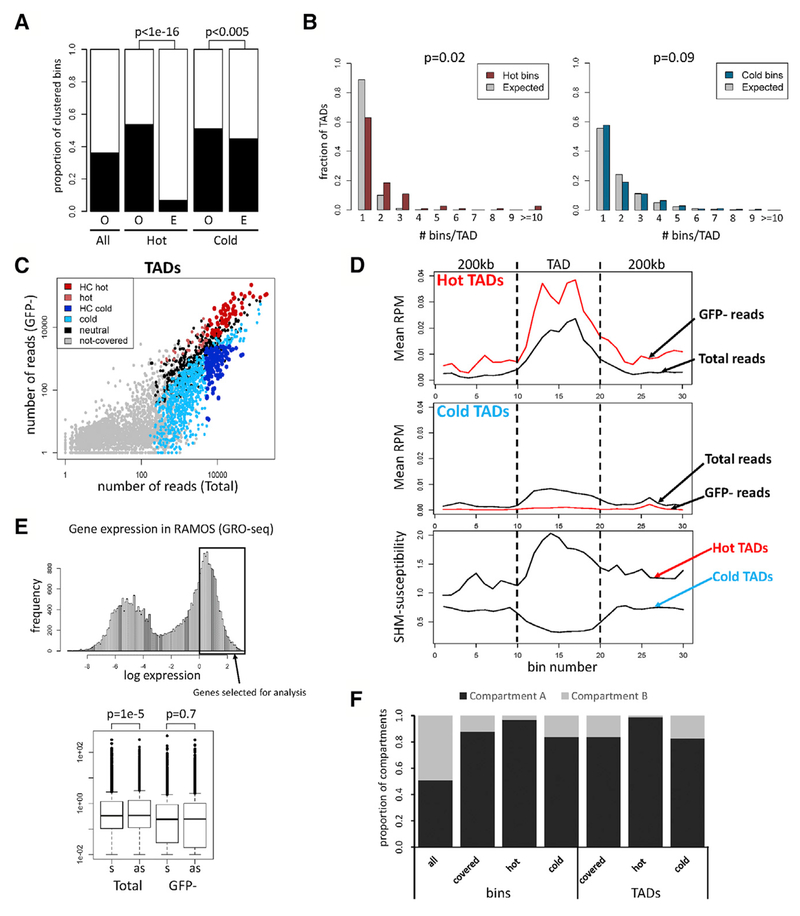
Figure 2. Regions Susceptible to SHM Correspond to TADs.
(A) Clustering of bins. Proportion of bins having at least one adjacent bin of the same category (O, observed) is compared to the proportion expected for random distribution (E, expected). Proportion of covered bins with an adjacent covered bin is also shown (All). Chi-square test was used.
(B) Distribution of hot and cold bins in TADs. The distribution of hot (left) or cold (right) bins in TADs containing at least one hot or cold bin, respectively, is plotted next to the expected distribution obtained when hot or cold bins were randomly assigned to those TADs (gray bars).
(C) Number of sequence reads from Total and GFP− populations in TADs. High-confidence (HC) hot and cold TADs, dark red and blue, respectively; TADs that are hot or cold in some experiments but do not meet HC criteria, light red and light blue, respectively; covered TADs that are neither hot nor cold (neutral), black.
(D) Distribution of SHM susceptibility at hot and cold TADs. TADs and 200-kb adjacent regions were divided into 10 bins, and normalized reads per million mapped reads (RPM) is plotted for hot (top) and cold (middle) TADs. Profiles of SHM susceptibility (ratio of GFP−:Total sequence reads), bottom.
(E) Analysis of GFP7 transcription orientation bias in active genes. Top: subset of highly expressed genes analyzed. Bottom: frequencies of GFP7 vectors integrated into these genes in sense (s) or antisense (as) orientation in Total and GFP− populations. Paired t test was used.
(F) Distribution of hot and cold bins and TADs in chromatin compartment A or B.

