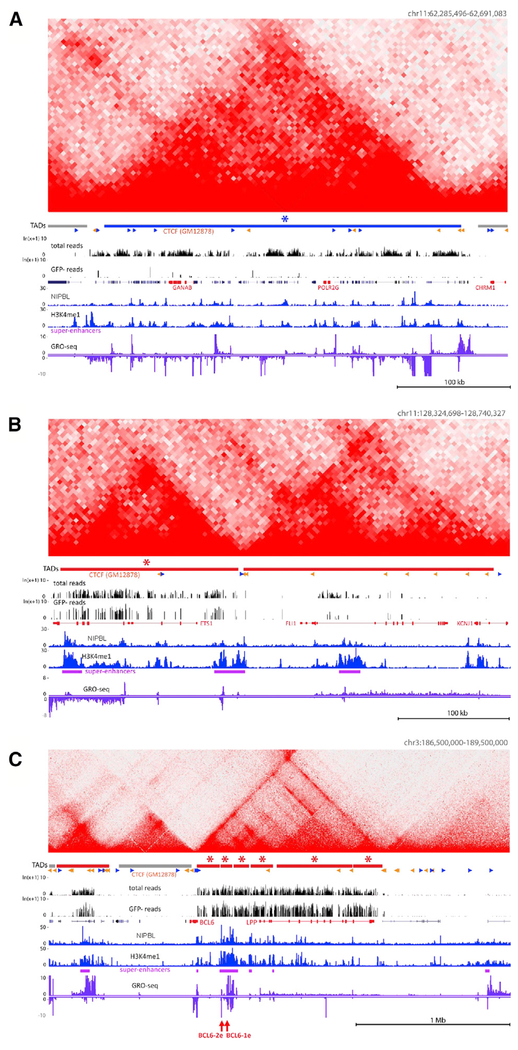
Figure 3. Examples of SHM-Susceptible and SHM-Resistant TADs.
(A–C) Hi-C matrices are shown above DIVAC-trap HTISA data for cold (blue; A) and hot (red; B and C) TADs; HC TADs are indicated by asterisks. CTCF motif orientations (sense, blue; antisense, orange) overlapping with CTCF ChIP-seq peaks for the GM12878 human lymphoblastic cell line are indicated, with other data tracks as in Figure 1. Juxtaposed hot TADs (B) and ~1.2 Mb TAD encompassing and upstream of BCL6 composed of six HC hot sub-TADs (C). Positions of candidate DIVAC-enhancer elements analyzed in Figure 5, red arrows.

