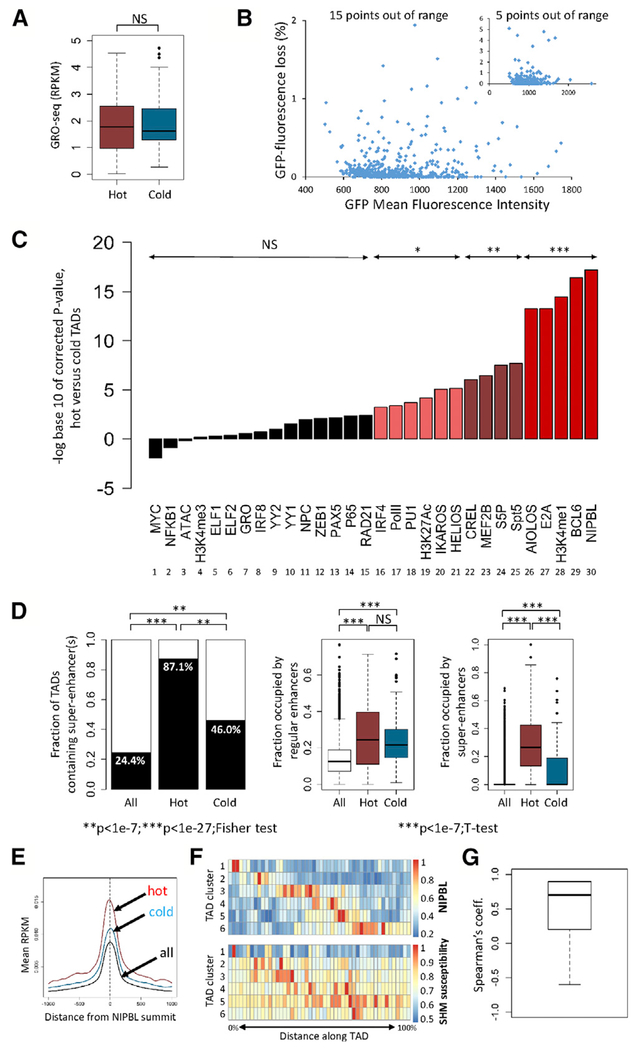
Figure 4. Epigenetic Environment Associated with SHM Susceptibility.
(A) Transcriptional activity (GRO-seq) in hot and cold TADs (reads per kilobase per million mapped reads [RPKM]). Two-tailed t test was used.
(B) GFP mean fluorescence intensity (a measure of vector transcriptional activity) and GFP fluorescence loss in 836 cell clones containing the no-DIVAC GFP7 vector (inset, same data plotted on different axes).
(C) Enrichment analysis in hot versus cold TADs. The signal for each parameter or factor (log(RPKM)) was compared between hot and cold TADs (two-tailed t test, with p values corrected for multiple hypothesis testing, Bonferroni correction). Corrected p values are plotted; NS, not significant; *p < 1.7 × 10e–3; **p < 1.7 × 10e–6; ***p < 1.7 × 10e–8. Data derived from Ramos: ChIP-seq for the indicated transcription or chromatin factors or modified histones, GRO-seq (GRO), and Assay for Transposase-Accessible Chromatin with high-throughput sequencing (ATAC-seq). NPC, nuclear pore components; Pol II, total RNA polymerase II; S5P, serine-5-phosphorylated Pol II.
(D) Analysis of enhancers and super-enhancers in hot and cold TADs. Fraction of TADs that contain one or more super-enhancer is shown (left); fraction of the length of each TAD that is occupied by regular enhancers (middle), or super-enhancers (right). Data for all hot and cold TADs are shown. Fisher exact test and two-tailed t test were used.
(E) Composite graph of NIPBL binding intensity to regulatory elements in hot, cold, and all TADs.
(F) Distribution of NIPBL binding and SHM susceptibility in hot TADs. Hot TADs were clustered based on similarities in their distribution of normalized NIPBL intensities into six groups (rows). NIPBL distribution (top heatmap) and distribution of SHM susceptibility (bottom heatmap) is shown for the six groups of TADs. Scale bars at right.
(G) Plot of correlation coefficients obtained by comparing the distribution of NIPBL binding intensity and SHM susceptibility for each pair of rows in the data from (F).

