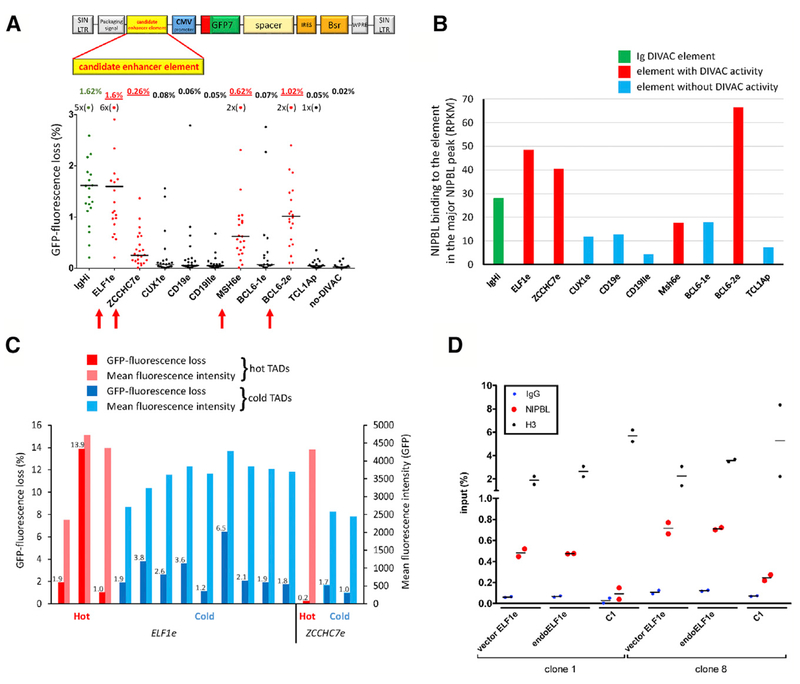
Figure 5. Identification and Characterization of Non-Ig DIVAC Elements.
(A) GFP fluorescence loss (3 weeks of culture) in Ramos clones infected with GFP7 containing no-DIVAC, IgHi, or candidate enhancer elements from loci, as indicated below the graph. Data presented as in Figure 1B. Data points outside the y axis range are in parentheses. Elements with detectable DIVAC activity, red arrows; schematic of GFP7, above.
(B) NIPBL ChIP-seq signal at the strongest NIPBL binding site in candidate enhancer elements in their endogenous context. IgHi and non-Ig elements exhibiting or lacking DIVAC activity, green, red, and blue, respectively.
(C) GFP fluorescence loss and mean GFP fluorescence intensity of clones infected with GFP7 containing ELF1e or ZCCHC7e. Vector integration sites in hot or cold TADs are indicated by red and blue bars, respectively. GFP fluorescence loss values are shown above the bars.
(D) ChIP-qPCR analysis of NIPBL binding in two independent Ramos clones harboring GFP7-ELF1e integrated in different cold TADs. Binding at endogenous ELF1e (endoELF1e) and vector ELF1e (vector ELF1e) was assessed within the major NIPBL peak; vector ELF1e contained two 5-bp substitutions to allow the design of primers specific for ectopic ELF1e. Each data point represents an independent measurement (average of duplicate technical replicas); bar indicates mean. C1, a NIPBL-non-binding region (based on NIPBL ChIP-seq data) in the TAD where the vector integrated in clone 1; H3, histone H3; IgG, control ChIP with non-specific antibody.

