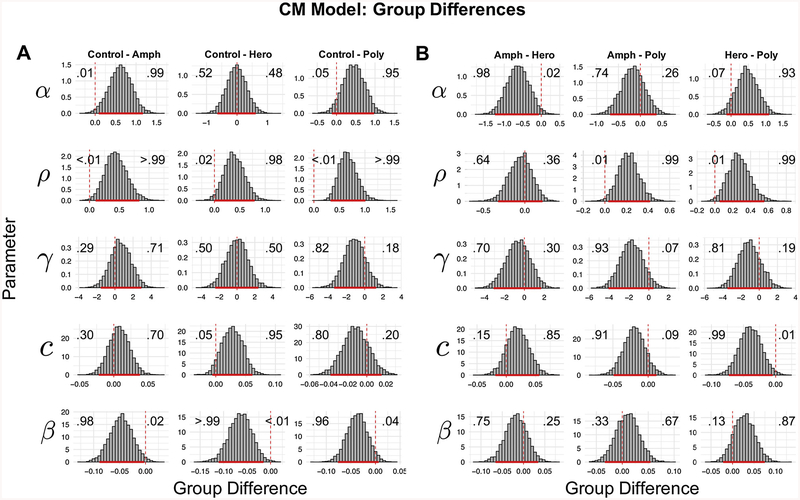
Fig. 4.
Group Differences in Posterior Estimates of Parameters Using Model 12.
(A) Posterior distribution of differences in estimated parameters between groups, using the best-fitting model (CM model with log valuation function; termed M12 in Supplementary Text). Each column shows the difference distributions between Controls and one of the substance-using groups. These differences are comparing each of the CM model hyper-parameters (i.e. the parameters reflecting group-level means). The solid red bars indicate the 95% Highest Density Interval (HDI) for each difference, meaning where 95% of the “mass” of the posterior distribution lies. Note that we do not endorse binary interpretations of significance using HDIs, and instead interpret the posterior distributions as continuous measures of evidence. The vertical dashed lines show where zero lies in each graph. The numbers overlaying each subplot indicate the proportion of the posterior distribution above and below 0, which can be interpreted as the model-estimated probability of a difference in parameter values between groups (where .50 indicates no evidence for a difference, and more peaked and diffuse distributions indicate more and less certainty in the inferred difference, respectively). (B) Posterior distributions of the differences in group-level CM model parameters between substance use groups. Solid and dashed lines and overlaying numbers are interpreted in the same way as for (A).

