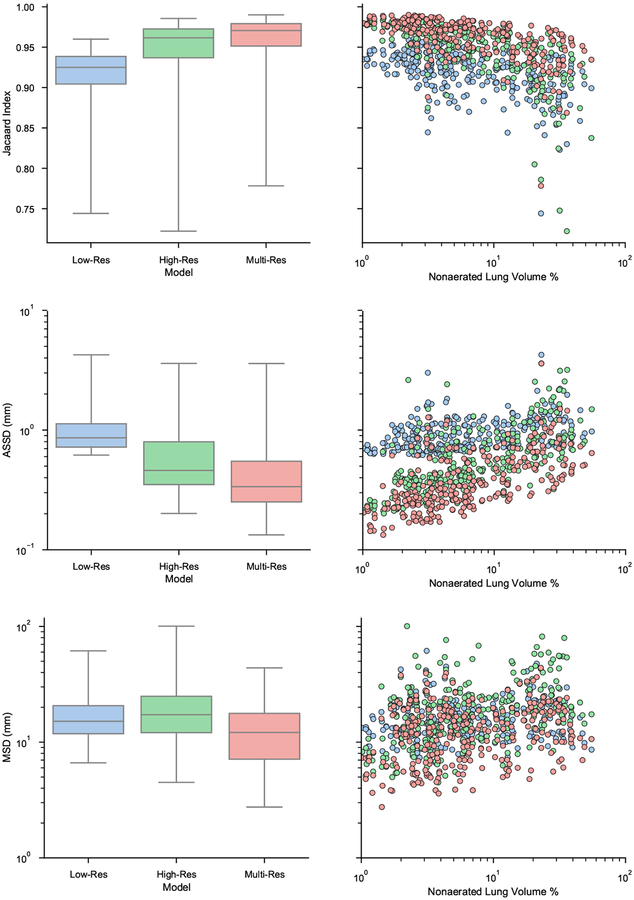
Figure 8:
Quantitative comparison of the three models. Each row depicts a different metric, from top to bottom: Jacaard index, ASSD, and MSD. Left column shows overall boxplots for each model. Right column shows a scatter plot depicting result for each lung image, stratified by the percent of non-aerated volume.

