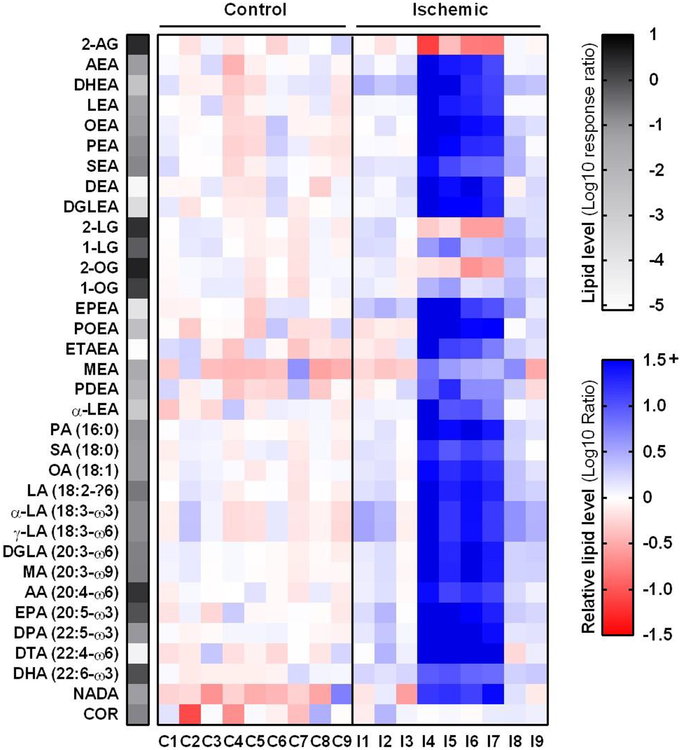
Figure 3 |. Ischemic heart tissues can be categorized into subgroups based on divergent lipid profiles.
Heatmap summary of lipid analysis of healthy (control) and ischemic cardiac tissue. Lipid levels were normalized to tissue weight and are expressed as mean response ratio of controls (grayscale, log10) or relative to mean control (red-blue scale, log10 ratio). Detailed lipid characteristics in Supplementary Table S2.

