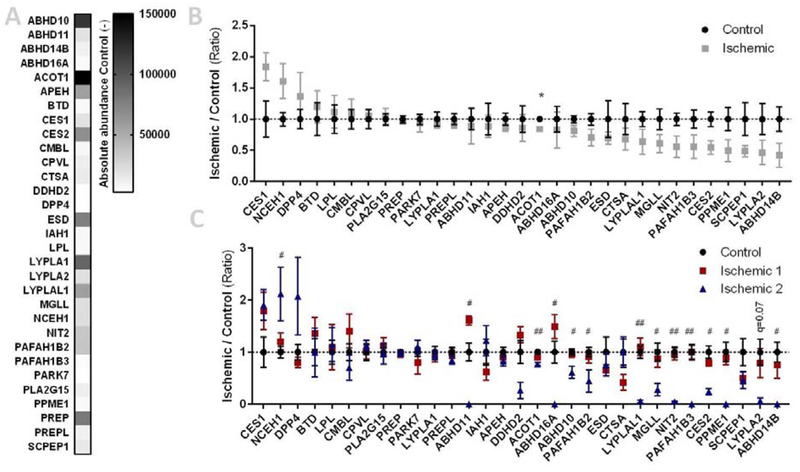
Figure 5 |. Activity-based proteomics on healthy and ischemic heart tissues.
(A-C) Lysates from healthy (control) and ischemic cardiac tissues were labeled with MB108 and FP-biotin (10 μM each, 30 min, 37 °C) and analyzed by mass-spectrometry. A pre-boiled sample (10% SDS, 100 °C, 5 min) served as negative control. (A) Heatmap summary of mean abundance of hydrolases from control tissues. (B) Hydrolase activity relative to mean control. Data is expressed as mean ± SEM (n=9), t-test with Benjamini-Hochberg correction: * q < 0.05. (C) Hydrolase activity relative to mean control, ischemic samples categorized in subgroups. Data is expressed as mean ± SEM (control n=9, ischemic 1 n=5, ischemic 2 n=4), t-test with Benjamini-Hochberg correction. Control versus ischemic 1: not significant; control versus ischemic 2: # q < 0.05, ## q < 0.01.

