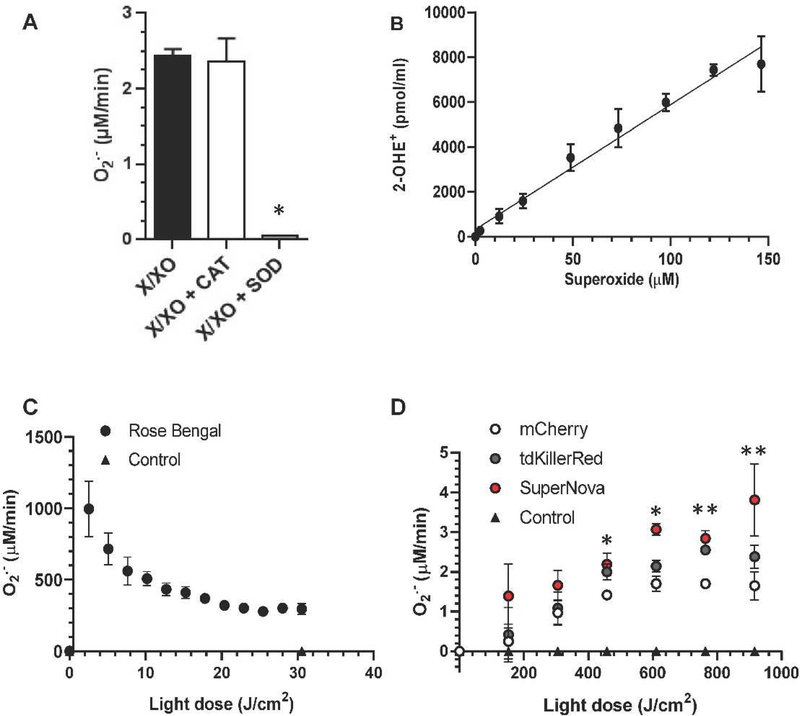
Fig. 3. Determination of superoxide production per light dose.
(a) xanthine/xanthine oxidase (X/XO) O2•- production was assessed using cytochrome c reduction assay. Xanthine oxidase (XO, 4 mU/mL) and xanthine (X, 1 mM) were incubated with catalase (CAT) superoxide dismutase (SOD) where indicated. * p < 0.05 X/XO+SOD vs X/XO and vs X/XO+CAT, one-way ANOVA, Tukey post hoc. (b) Time course (0–60 min) of X/XO O2•- generation was measured using HPLC separation of 2-OHE+ and then plotted against the expected O2•- production. (c) Rose Bengal O2•- production rate per light dose. (d) Fluorescent protein (mCherry, tdKillerRed and SuperNova) O2•- production per light dose. Data from (c) and (d) are derived from data presented in Fig. 2. *p < 0.05 SuperNova vs mCherry, ** p < 0.05 SuperNova and tdKillerRed vs mCherry, two-way ANOVA, Bonferroni post hoc. Values are mean ± SD for n = 3 independent experiments.

