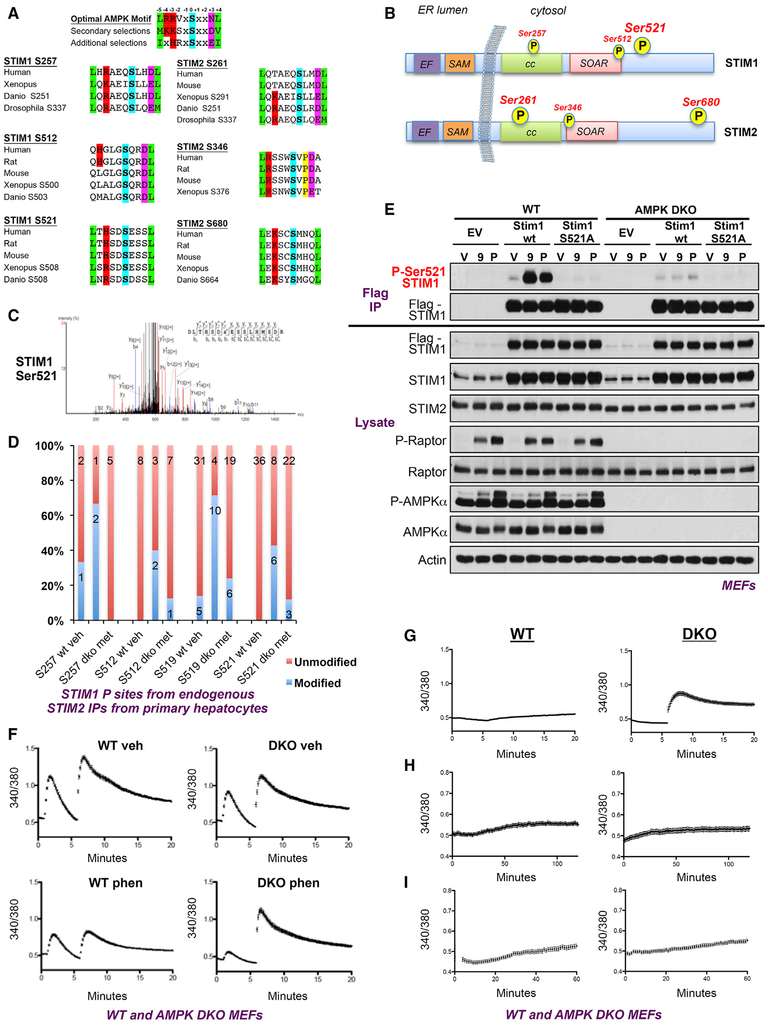
Figure 7. AMPK Regulates Calcium Homeostasis through Phosphorylation of Stim1 and Stim2 to Terminate Store Operated Calcium Entry.
(A) Clustal alignments of STIM1 S257, S512, S521, and STIM2 S261, S346, S680 across species showing conservation of AMPK consensus motif at identified potential sites of regulation.
(B) Schematic depicting location of potential AMPK sites of regulation on STIM1 and STIM2 on structure of each protein relative to orientation to cytosol and ER lumen.
(C) Representative MS/MS trace for identified STIM1 Ser521 site in STIM1 IP-MS in AMPK WT MEFs.
(D) Regulated phosphorylation sites on STIM1 identified in STIM2 endogenous IP-MS in primary hepatocytes reported by spectral count.
(E) Mouse embryonic fibroblasts stably expressing empty vector, flag-STIM1-WT, flag-STIM1-Ser521Ala in a WT or AMPK DKO background treated with vehicle, 50 μM MK-991 (9) or 2 mM phenformin (P) for 1 h. Flag immunoprecipitates blotted with antibody raised against the STIM1 Ser521 site and re-probed with antiflag antibody for loading.
(F) Reduction of SOCE in AMPK WT MEFs but not AMPK DKO MEFs in response to AMPK activation quantitated by single cell microscopy using fura2-AM. Cells treated with vehicle or 2 mM phenformin in DMEM + 10% FBS for 30 min prior to analysis. Following pre-treatment, media was removed and replaced with Ca2+-free HBSS containing 2 mM phenformin prior to analysis. ER Ca2+ stores were emptied with 2 μM thapsigargin in Ca2+-free conditions before addition of buffer containing 2 mM Ca2+.
(G) Same Fura2-AM measurements without Thapsigargin treatment to empty ER calcium stores. Induction of SOCE in response to calcium addition only seen in AMPK DKO cells in the absence of Tg treatment in phenformin-treated cells.
(H) Controls traces for (F), switching the media from calcium-free to calcium-containing media in the absence of phenformin treatment.
(I) Control traces for (F) with treatment of phenformin in the presence of calcium containing media at all times. All Fura2-AM graphs (F–I) show mean fura2 ratio of 60 (WT) and 60 (KO) cells across 2 biological replicates containing 30 single-cell readings each.

