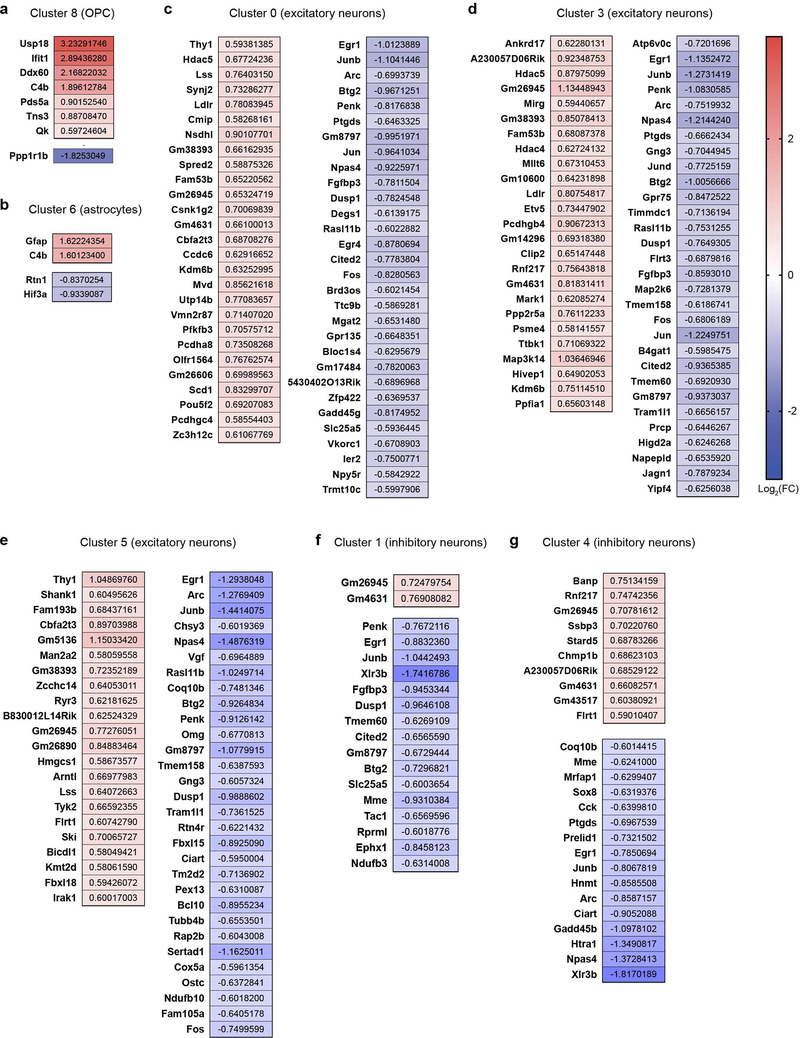
Extended Data Fig. 5. Heat maps of fold changes of DEGs in OPC, astrocyte, and neuron clusters in the 7-month-old mouse cohort.
Cluster-by-cluster analysis of differential gene expression. Heat maps showing the top 30 (or less) DEGs (fold change>1.5, two-part hurdle model, adjusted p-value<0.05, Bonferroni correction), ordered by adjusted p-value, and results are presented for comparisons of 5XFAD vs. WT. Numbers indicate log2(Fold change). Analyses are presented for the following clusters: a, cluster 8 (OPC), n=485 5XFAD and 705 WT cells; b, cluster 6 (astrocytes), n=490 5XFAD and 1,088 WT cells; c, cluster 0 (excitatory neurons), n=3,302 5XFAD and 4,396 WT cells; d, cluster 3 (excitatory neurons), n=1,941 5XFAD and 3,038 WT cells; e, cluster 5 (excitatory neurons), n=1,530 5XFAD and 1,912 WT cells; f, cluster 1 (inhibitory neurons), n=2,606 5XFAD and 3,315 WT cells; and g, cluster 4 (inhibitory neurons), n=1,672 5XFAD and 2,660 WT cells. n=3 biologically independent mouse brain samples per genotype. The lists of genes are in Supplementary Table 1.

