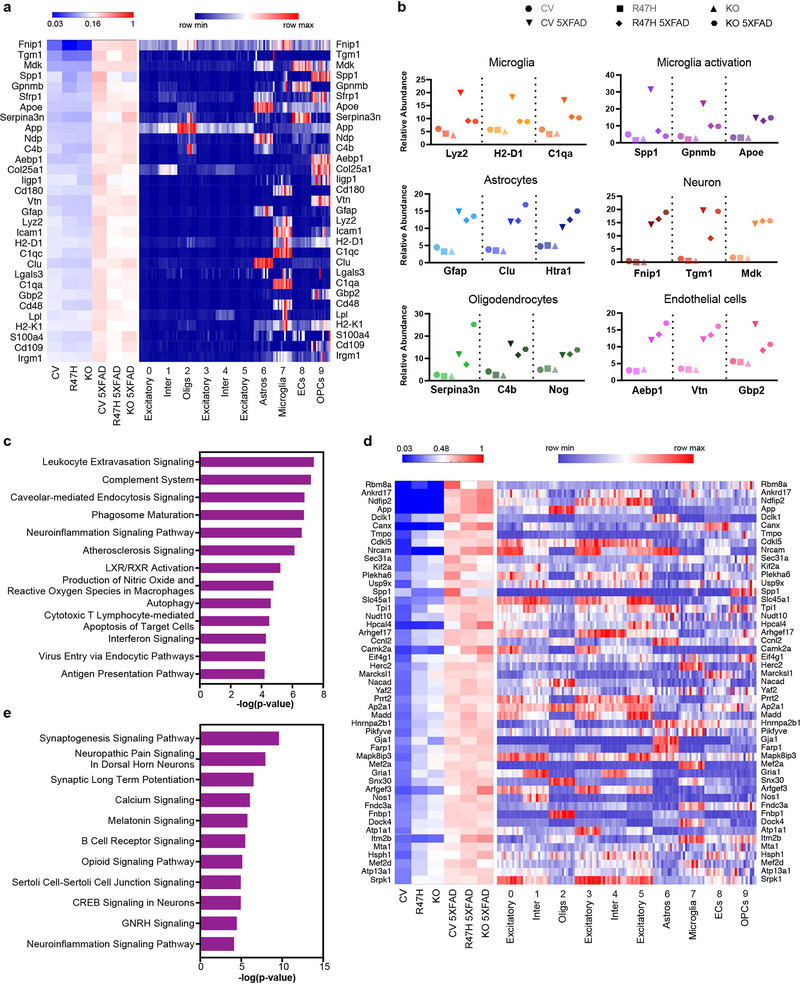
Extended Data Fig. 6. Proteomic analysis recapitulates major findings from snRNA-seq analysis.
a, Left panel: Heat map of relative abundance of the most significantly upregulated proteins from proteomics in CV 5XFAD compared to CV mice, ranked by fold change. Total protein analysis was conducted on brain tissues from 10-month-old CV, R47H, Trem2−/− (KO), CV 5XFAD, R47H 5XFAD and KO 5XFAD mice. Right panel: Heat map showing average expression of corresponding gene in each cluster in snRNA-seq of every mouse from 7-month-old cohort. Each column represents one individual mouse. Within a cluster, mice from left to right: WT1-3, Trem2−/−1–3, WT 5XFAD1-3, Trem2−/− 5XFAD1-3. b, Relative abundance of selected proteins upregulated in different cell types. c, IPA analysis showing pathways upregulated in CV-5XFAD compared to CV mice in proteomics. n=312 genes, Fisher’s exact test. d, Left panel: Heat map of relative abundance of proteins with the most significantly upregulated phosphopeptides from phosphoproteomics in CV 5XFAD compared to CV mice, ranked by fold change. Right panel: Heat map showing average expression of corresponding gene in each cluster in snRNA-seq of every mouse from 7-month-old cohort. Each column represents one individual mouse. Within a cluster, mice from left to right: WT1-3, Trem2−/−1–3, WT 5XFAD1-3, Trem2−/− 5XFAD1-3. e, IPA analysis showing pathways upregulated in CV-5XFAD compared to CV mice in phospho-proteomics. n=270 genes, Fisher’s exact test.

