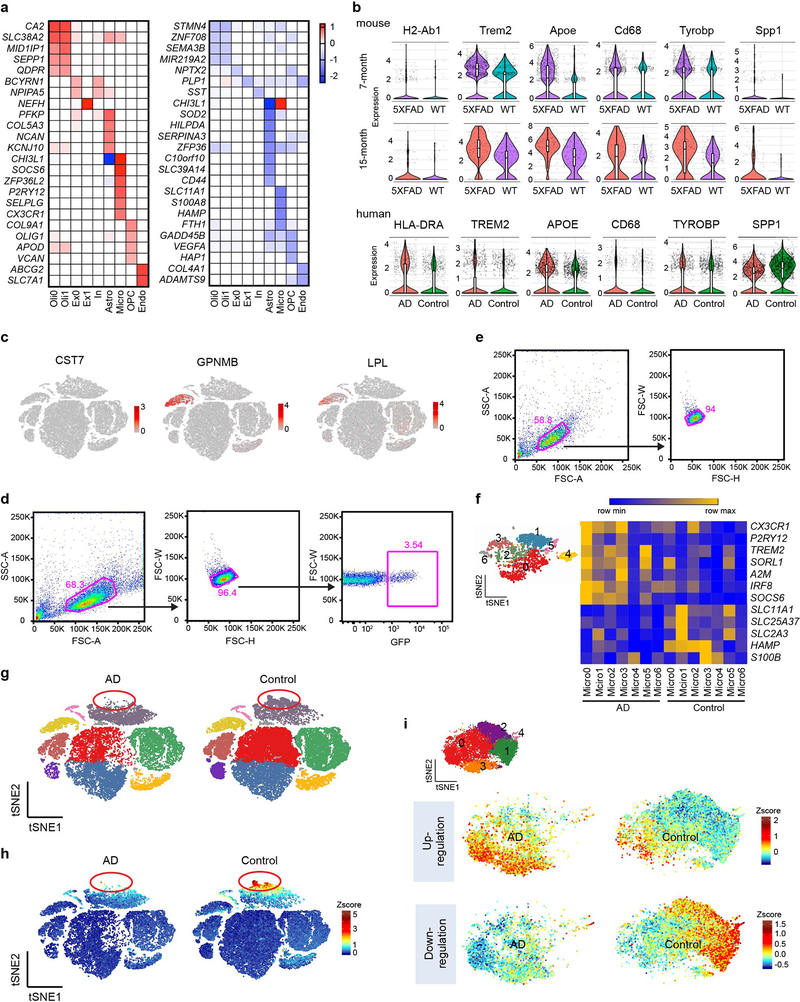
Extended Data Fig. 8. AD-associated human signatures are distinct from that in Aβ mouse models.
a, Heat maps showing fold change of top DEGs (log2(FC)>0.5, two-part hurdle model, adjusted p-value<0.05, Bonferroni correction) between AD (CV) and control in all clusters. Left, genes up-regulated in AD. Right, genes down-regulated in AD. Numbers indicate log2(FC). n=11 AD (CV) patients and 11 controls. b, Violin plots showing expression of mouse DAM genes in 7- and 15-month-old mouse snRNA-seq and their homologs in human snRNA-seq within the microglia cluster. Violin plots are presented with floating boxes showing median (middle line) and quartiles (top and bottom). Minima and maxima are shown as the bottom and top of the violin plots. 7-month-old mouse, n=3 biologically independent mouse brains per genotype, 524 WT, 582 Trem2−/−, 1,123 WT 5XFAD, and 604 Trem2−/− 5XFAD microglial cells; 15-month-old mouse, n=266 WT, 92 Trem2−/−, 171 WT 5XFAD, and 88 Trem2−/− 5XFAD microglial cells, pooled from 3 mouse brains per genotype; human, n=11 controls, 1,547 cells; 11 AD patients, 919 cells. c, t-SNE plots showing the cell type of origin of selected DAM genes in the human brain. Color scheme shows expression. n=66,311 total cells. d, Gating strategy for viral transduced BMDMs. WT BMDMs were transduced with virus containing empty pESV-ires-eGFP vector or Irf8-overexpressing (OE) pESV-Irf8-ires-eGFP vector. Successfully transduced cells were identified by GFP+ gate. e, Gating strategy for WT and Irf8−/− BMDMs. f, Heatmap representing the average gene expression of top microglia DEGs in microglia sub-clusters in AD versus control samples. Color scheme shows row max and row min. g, t-SNE projection of all nuclei in AD versus control samples showing the lack of a sub-population of astrocytes in AD. Red circle indicates the population. Colors correspond to individual clusters. n=66,311 total cells. h, t-SNE plots showing the average z-scores of down-regulated genes in astrocytes. Red circle indicates the disappearing population enriched for down-regulated genes. n=65 down-regulated genes in astrocytes listed in Supplementary Table 4 were used as inputs. i, t-SNE plots of oligodendrocyte sub-clusters showing average z-scores of DEGs in oligodendrocytes. Top, up-regulated genes are enriched in Oligo0 and Oligo3 (indicated in Fig.5). Bottom, down-regulated genes are enriched in Oligo1 and Oligo2. n=20 up- and 23 down-regulated genes in oligodendrocytes listed in Supplementary Table 4 were used as inputs.

