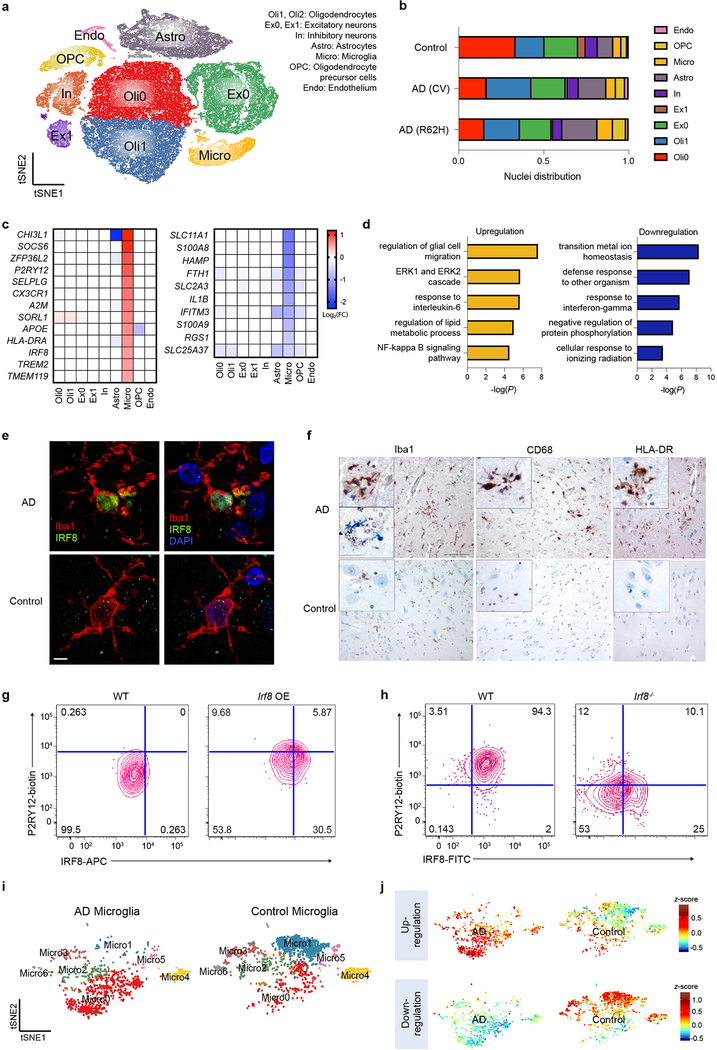
Fig. 4. Human AD brain exhibits a distinct microglia signature from mouse.
a, t-SNE plot showing 10 clusters from 11 AD patients with TREM2 CV, 10 AD patients with TREM2 R62H and 11 non-AD controls. n=66,311 total cells. b, Bar-graph presenting frequency of each cluster in every group. c, Heat maps showing fold change of top DEGs (log2(FC)>0.5, two-part hurdle model, adjusted p-value<0.05, Bonferroni correction) in microglia, comparing AD (CV) versus control. Left, genes up-regulated in AD. Right, genes down-regulated in AD. n=11 AD (CV) patients, 919 cells; 11 controls, 1,547 cells. d, Gene Ontology terms associated with genes up-regulated (left) and down-regulated (right) in AD. n=45 up-regulated, 47 down-regulated genes, hypergeometric test. e, Representative IF images of AD and control cortical samples showing nuclear IRF8 staining within Iba1+ microglia in AD. Scale bar, 5 μm. The experiment was performed twice. f, Representative IHC from AD cortical autoptic samples and age-matched controls showing microglia upregulate Iba1, CD68 and HLA-DR in AD. Insets show higher magnification of the corresponding panels. Lower inset in Iba1 AD panel shows double staining of Iba1+ microglia in blue surrounding silver+ plaques. Scale bars: 100 μm (panels); 30 μm (insets). The experiment was performed six times. g,h, P2RY12 level in mouse microglia-like cultures is increased upon Irf8 overexpression (OE) (g) and decreased in Irf8−/− cultures (h), compared to WT cultures. Data represent two (g) or three (h) independent experiments. Numbers indicate cell frequency in each quadrant. i, t-SNE plots of re-clustered microglia showing 7 sub-clusters. Micro0 is increased in AD; Micro1 is reduced. n=919 AD and 1,547 control microglial cells. j, t-SNE plots showing average z-scores of DEGs in microglia. Top, up-regulated genes are enriched in Micro0. Bottom, down-regulated genes are enriched in Micro1. n=46 up- and 47 down-regulated genes in microglia listed in Supplementary Table 4 were used as inputs.

