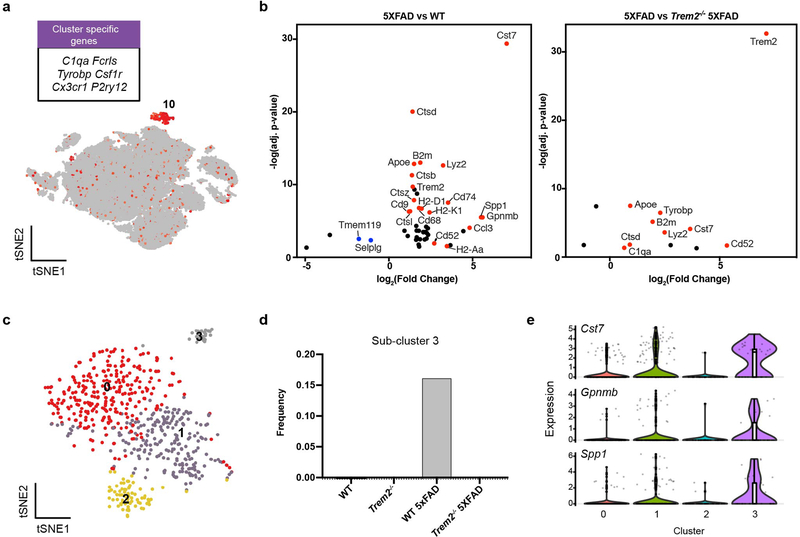
Extended Data Fig. 3. Characterization of the microglia cluster in the 15-month-old mouse cohort.
a, t-SNE plot showing the microglia cluster (cluster 10 from Extended Data Fig. 2), expressing microglia genes, such as C1qa, Fcrls, and Tyrobp. b, Volcano plots showing DEGs (Fold change>1.5, two-part hurdle model, adjusted p-value<0.05, Bonferroni correction) of 5XFAD vs. WT (effect of Aβ) and 5XFAD vs. Trem2−/− 5XFAD (dependence of Trem2) in microglia. c, t-SNE plot of re-clustered microglia (from cluster 10) identifying 4 sub-clusters. d, Bar graphs showing the relative frequency of sub-cluster 3 in each sample. Sub-cluster 3 is only present in the 5XFAD sample. e, Violin plots showing the expression of DAM genes, Cst7, Gpnmb and Spp1, enriched in sub-cluster 3. Violin plots are presented with floating box showing median (middle line) and quartiles (top and bottom). Minima and maxima are shown as the bottom and top of the violin plots. n=266 WT, 92 Trem2−/−, 171 WT 5XFAD, and 88 Trem2−/− 5XFAD microglial cells, pooled from 3 mouse brains per genotype (a,b,c,e).

