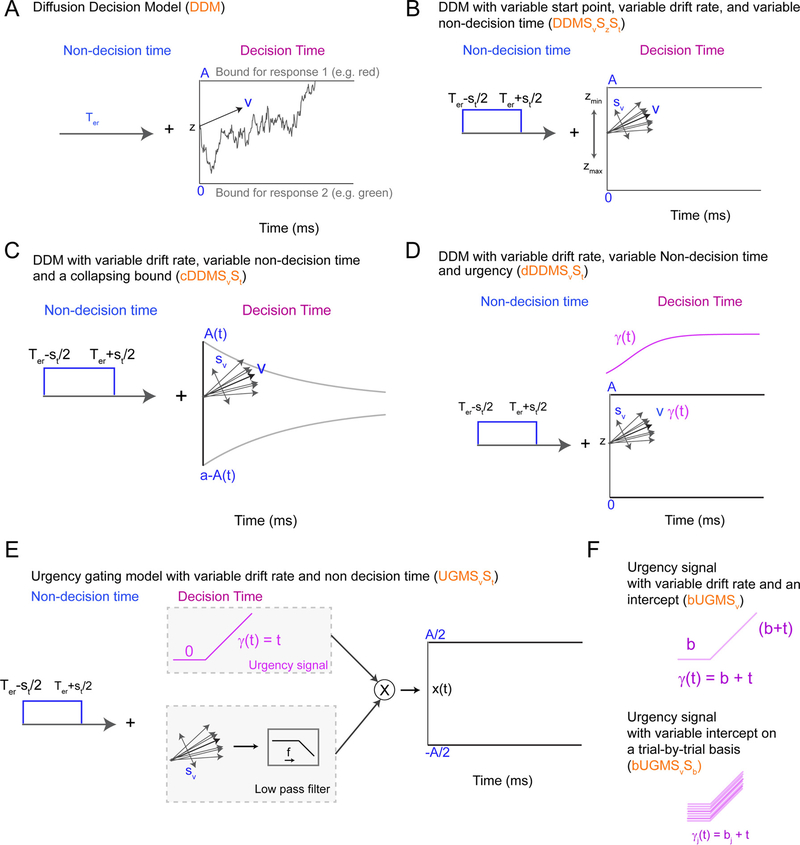
Fig. 1.
Schematic of some sequential sampling models of decision-making incorporated in ChaRTr. (A) The DDM model is the simplest example of a diffusion model of decision-making. (B) A variant of the DDM with variable non-decision time (St), variable drift-rate (Sv) and a variable start point (Sz). (C) A DDM with collapsing bounds and variability in the non-decision time and drift rate. The function A(t) takes the form of a Weibull function as defined in Eq. (6). (D) A variant of the DDM with variable non-decision time and drift rate, and an “urgency signal”. This urgency signal grows with elapsed decision time, which is implemented by multiplying the decision variable by the increasing function of time γ(t) (Eq. (10), following Ditterich, 2006a). (E) UGM with variable drift rate (Sv) and variable non decision time (St). In the standard UGM, the urgency signal is only thought to depend on time and thus starts at 0. The sensory evidence is passed through a low pass filter (typically a 100–250 ms time constant, Carland et al., 2015; Thura et al., 2012). The sensory evidence is then multiplied by the urgency signal to produce a decision variable that is compared to the decision boundaries. (F) Schematic of urgency signals with an intercept (top panel) and a variable intercept (bottom panel).

