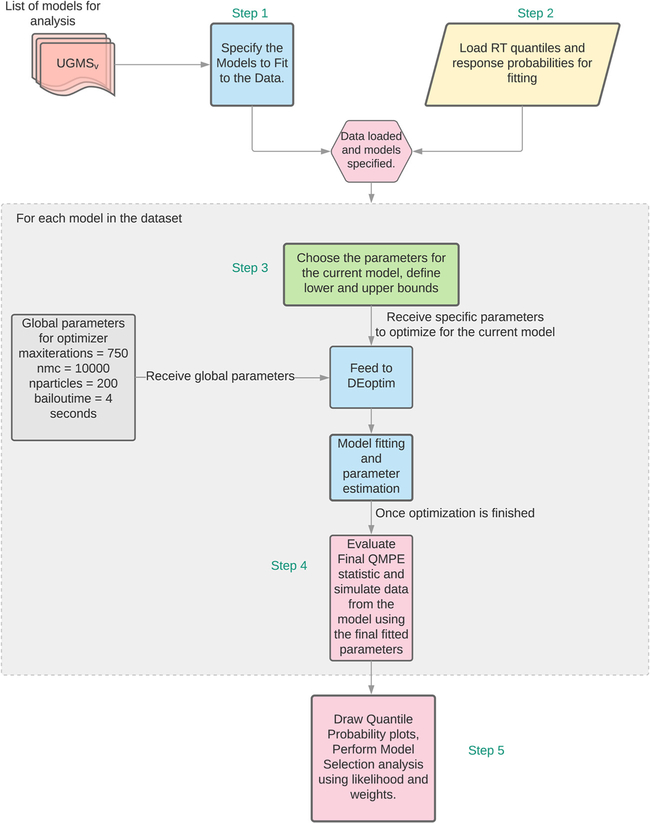
Fig. 3.
ChaRTr flow chart. Models are specified and once data is available, the parameters are estimated through the optimization procedure. Once parameter estimation is complete, the final goodness of fit statistic is calculated for every model under consideration, which is used for subsequent model selection analyses.

