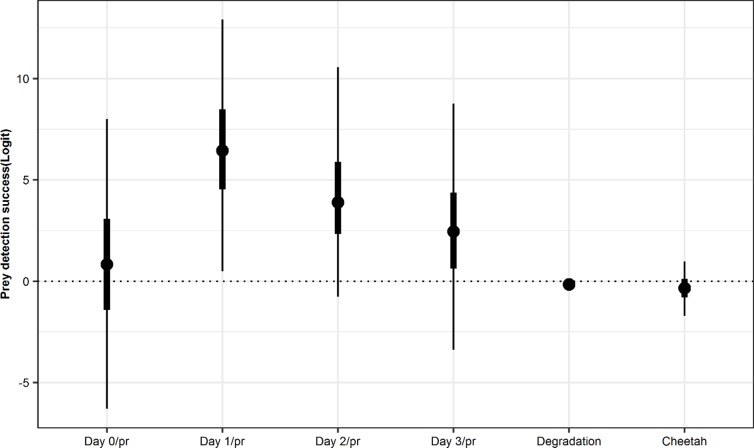
Fig 1. The relative success of prey DNA detection on a given day after feeding (according to the proportion of prey consumed), degradation day and individual cheetah.
The points are the posterior means and the bold and thin lines represent the 50% and 95% credible intervals around the means respectively.

