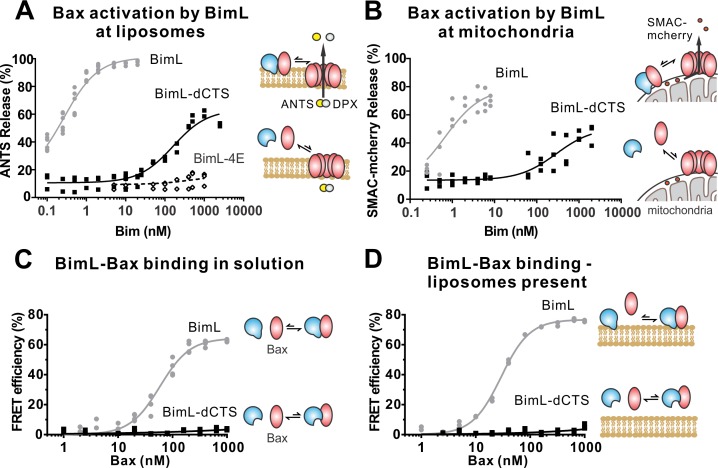
Figure 3. The Bim CTS is required to activate Bax to permeabilize membranes.
Cartoons indicate the binding interactions being measured. Equilibria symbols indicate the predicted balance of complexes for BimL (blue), Bax (red), liposomes (tan), mitochondria (black). For each graph, data from three independent experiments are shown as individual points. Due to overlap, some points may not be visible. (A) Activation of Bax by BimL assessed by measuring permeabilization of ANTS/DPX filled liposomes (0.04 mg/mL) after incubation of Bax (100 nM) with the indicated concentrations of BimL or BimL-dCTS. Fluorescence intensity, indicative of membrane permeabilization, was measured using the Tecan infinite M1000 microplate reader and converted to percent release by comparison with detergent-mediated liposome lysis. (B)Permeabilization of the outer mitochondrial membrane by Bax (50 nM) in response to activation by the indicated amounts of Bim and BimL-dCTS was assessed by measuring SMAC-mCherry release from mitochondria. (C) Bim binding to Bax in solution measured by FRET. Alexa568-labeled BimL or BimL-dCTS (4 nM) was incubated with the indicated amounts of Alexa647-labeled Bax and FRET was measured from the decrease in Alexa568 fluorescence. (D) Bim binding to Bax measured by FRET in samples containing mitochondrial-like liposomes. FRET was measured as in (C) with 4 nM Alexa568-labeled BimL or BimL-dCTS and the indicated amounts of Alexa647-labeled Bax.

