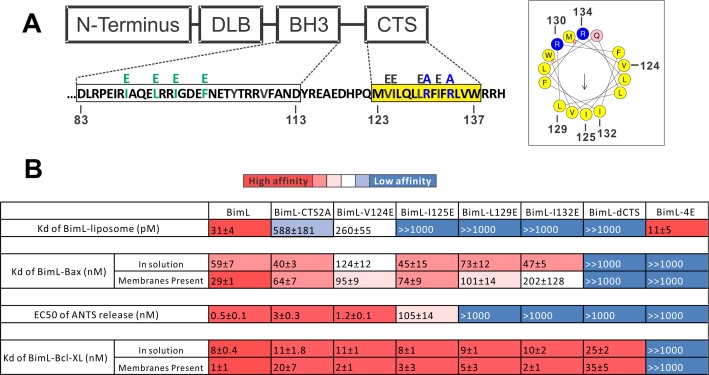
Figure 6. Residues within the Bim CTS distinctly regulate membrane binding and Bax activation.
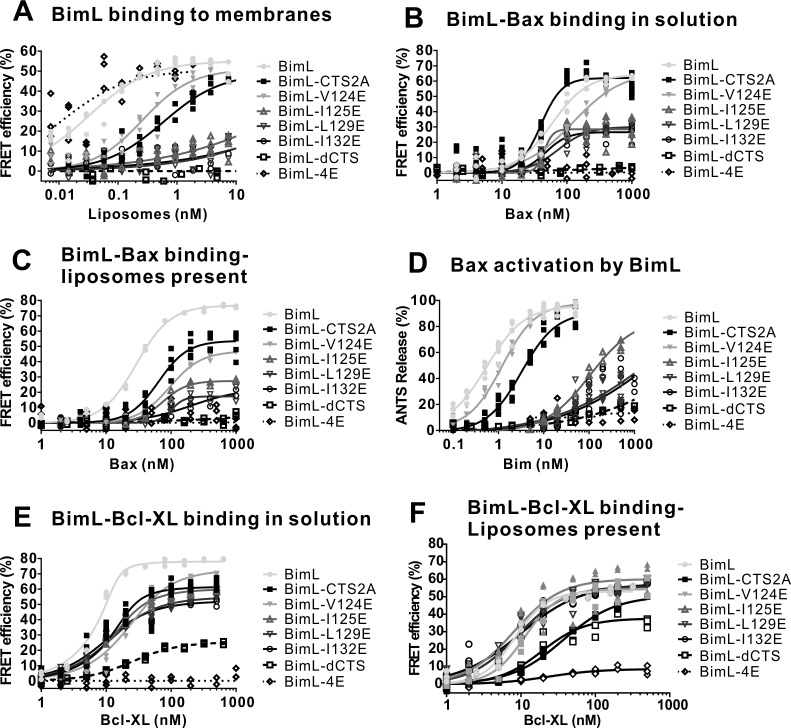
(A) Diagram of BimL depicting the various domains (DLB: dynein light chain binding motif) and the sequences of the BH3-domain and CTS. The four essential hydrophobic residues in BH3-domain that were mutated to glutamic acid are colored green. Two positive charged residues in the CTS mutated to alanine are colored blue. Glutamic acid mutations for individual hydrophobic residues in the CTS are indicated in black on top of the original sequence. A predicted alpha helix structure generated via HeliQuest software is shown on the right, indicating the amphipathic nature of the CTS. The arrow central to the helix shows the polarity direction for hydrophobicity. The Q indicated in pink is the fifth amino acid in the CTS. Other residues are colored as in the linear sequence. (B) Binding of BimL mutants to liposomes, Bax and Bcl-XL expressed as apparent dissociation constants (Kd) measured from raw data as in Figure 6—figure supplement 1 for each binary interaction. Activation of Bax (EC50) measured from ANTS/DPX assays in Figure 6—figure supplement 1. Values are mean ± SEM (n = 3). The table is colour-coded in a heat map fashion as follows: red 0–40; light red 40–80; light pink 80–120; white 120–500; light blue 500–1000; Dark blue >1000. All values are nM except for binding to liposomes which is in pM. The Kds for ‘membranes present’ measurements are apparent values since diffusion for the protein fraction bound to membranes is in two dimensions while diffusion for the fraction of protein in solution is in three dimensions and several of the binary interactions take place in both locations. Apparent Kd values may also be affected by competing interactions with membranes.


