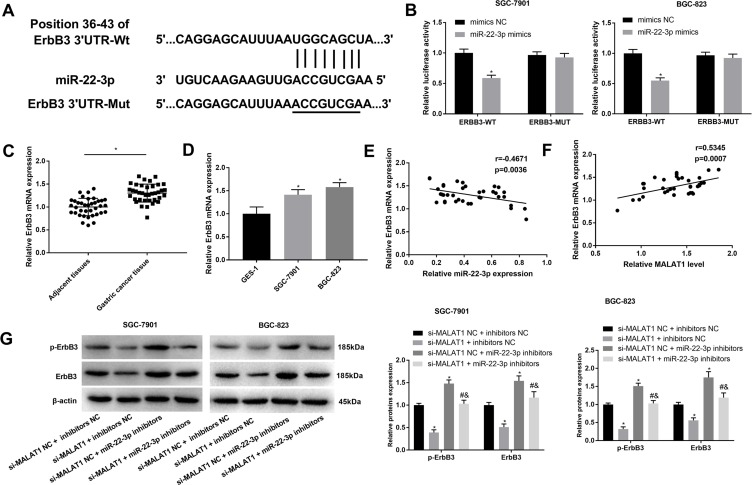
Figure 5.
Interaction between ErbB3 and miR-22-3p. (A) A binding site predicated by Target Scan (http://www.targetscan.org/); (B) A target interaction identified by DLR assay; (C) Relative ErbB3 expression in gastric cancer (GC) tissues and adjacent normal tissues at the mRNA level (N = 37); (D) Relative ErbB3 expression in GC cell lines, SGC-7901 and BGC-823 and a normal human gastric mucosal epithelial cell line, GES-1 at the mRNA level; (E) Correlation analysis of the relationship between ErbB3 and miR-22-3p in GC tissues (N = 37); (F) Correlation analysis of the relationship between ErbB3 and MALAT1 in GC tissues (N = 37); (G) Relative ErbB3 and p-ErbB3 expression in transfected SGC-7901 and BGC-823 cells. si-MALAT1, siRNA-MALAT1; si-MALAT1 NC, siRNA-MALAT1 negative control; inhibitors NC, miR-22-3p inhibitors negative control. Each experiment was performed in three replicates. *P < 0.05 vs mimics NC (B), adjacent tissues (C), GES-1 (D), and si-MALAT1 NC + inhibitors NC (G); #P < 0.05 vs si-MALAT1 + inhibitors NC; &P < 0.05 vs si-MALAT1 NC + miR-22-3p inhibitors.

