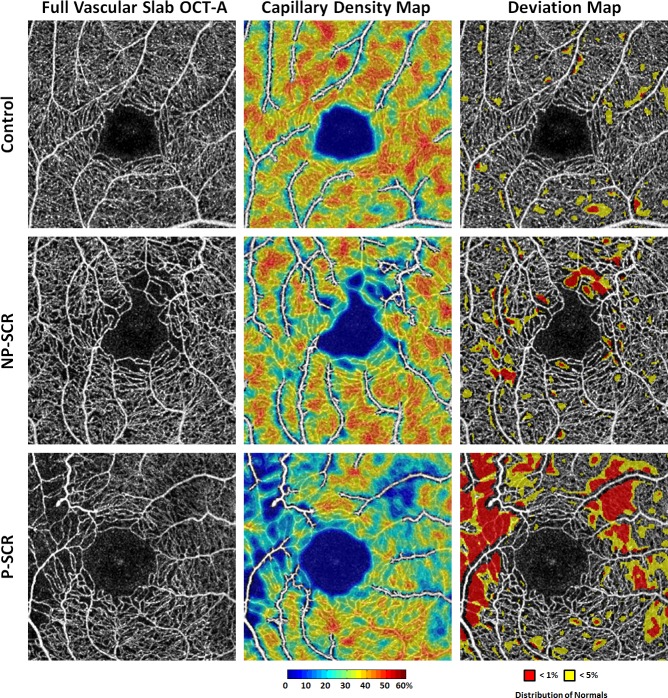
Figure 5.
Comparison of parafoveal capillary density and deviation maps in (top row) healthy control, (middle row) NP-SCR and (bottom row) P-SCR. (Left column) Contrast-stretched full vascular slab OCT-A. (Middle column) Parafoveal capillary density maps with non-capillary blood vessels indicated in white due to the exclusion from density computation. (Right column) Corresponding deviation maps. Parafoveal capillary density below 5% and 1% of the normative database is indicated in yellow and red, respectively. While parafoveal capillary density decreases, total area below 5% and 1% of normal distribution increases with increasing SCR severity. The temporal aspect of the parafovea is to the left in all images. NP-SCR, non-proliferative sickle cell retinopathy; OCT-A, optical coherence tomography angiography; P-SCR, proliferative sickle cell retinopathy.

