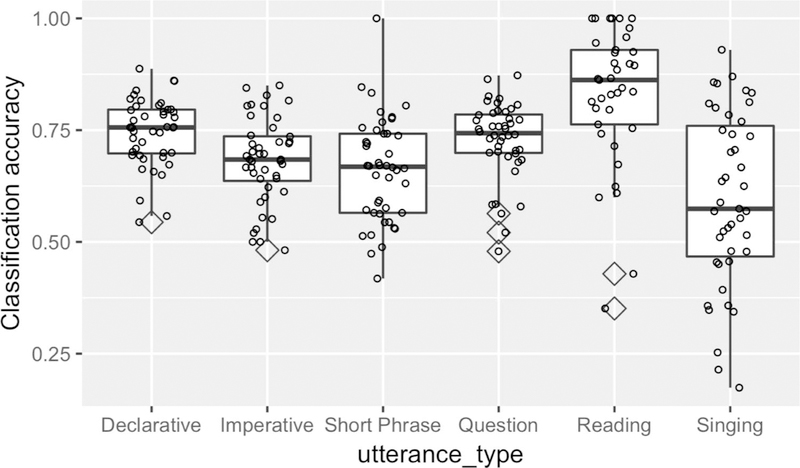
Figure 2 .
Classification accuracy distribution by utterance-type across the four main categories: adult, child, electronic or overlap. The box plot reflects the median of the means for each infant for each utterance-type. Each point (jittered horizontally) represents one child; diamonds (unjittered) indicate outliers.

