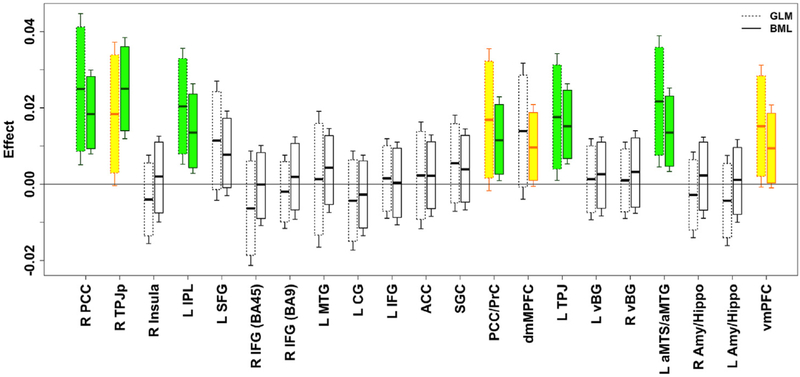
Fig. 8.
Comparisons of results between the conventional region-based GLM and BML in box plots. For each region, the left box shows the GLM result that was inferred with the region as an isolated entity while the right box corresponds to the BML inference. With one GLM for each of the 21 regions, none of the regions would survive FPR correction under NHST. The effect is shown with the horizontal black bar in the middle of each box as the mean for GLM or median for BML; each box (or whisker pair) represents the 90% (or 95%) confidence interval for GLM (dashed, left) or uncertainty interval for BML (solid, right). The shrinkage or pooling impact of BML calibrates and “drags” most but not all regions (see R TPJp). Reprinted from Chen et al. (2019a).

