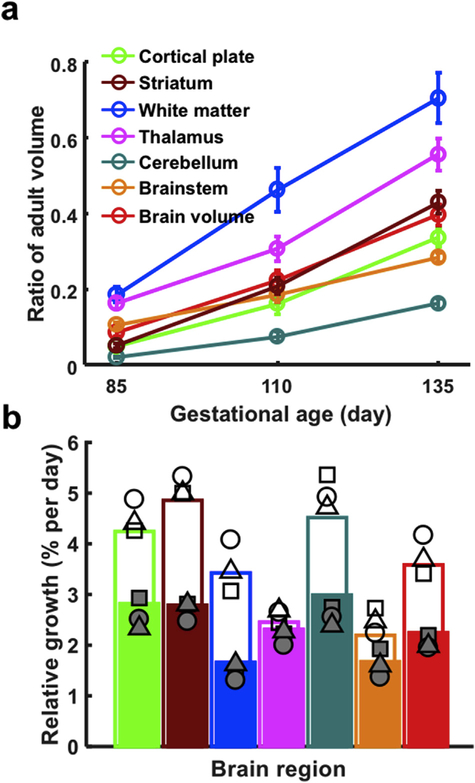
Fig. 5.
(a) Growth trajectories of different structures, and (b) relative growth rates over the G85-G110 (open bars) and G110-G135 intervals (closed bars). In (a), at G85, all structures are less than 20% of their volumes at maturity. By G135, a wide range of volumes are observed, the fetal white matter possessing highest percentage of its adult volume (70.5%) while the cerebellum exhibits the smallest percentage of its adult volume (16.2%). Error bars are standard deviations for each brain region at each age. In (b), relative brain growth (%/day) is universally faster between G85 and G110 than between G110 and G135. Growth is faster in telencephalic structures (cortical plate, WM, and the striatum between G85 and G110) than in other structures (thalamus, brainstem), with the notable exception of the cerebellum. Growth rates from individual fetuses 1–3 in Table 1 (fetus 1 is represented as a circle, fetus 2 is represented as a square, and fetus 3 is represented as a triangle) are overlaid on growth rates calculated from average brain volumes (colored bars) to illustrate the scale of variability in the growth measures.

