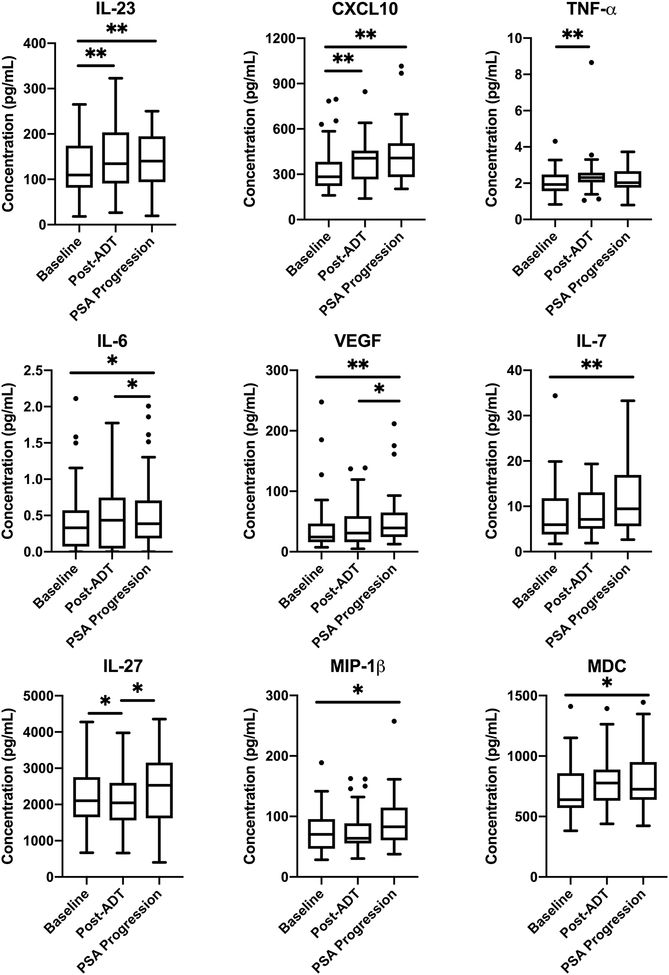
Figure 1. ADT is associated with changes in cytokine levels.
Cytokine concentrations at baseline, three months after ADT, and at time of PSA progression in all 37 analyzed patients. Horizontal lines represent the median, boxes the interquartile range (IQR), and whiskers the upper and lower quartiles. Wilcoxon signed-rank sum test was used to compare paired observations between different time points. Horizontal bars denote statistical significance between time points (P < 0.05 *, < 0.01 **). Outliers represented by black dots.

