
Figure 1.
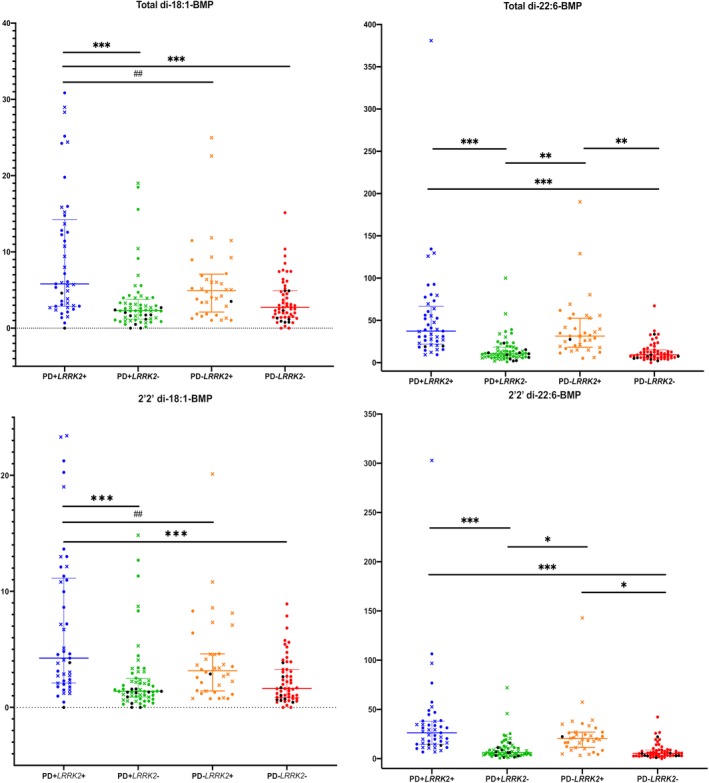
Levels of BMP isoforms in the combined LCC and CUIMC data sets. (A–D) Data for a specific BMP isoform measured in the 4 groups indicated on the X axis. Circular symbols indicate the measurement was from the CUIMC cohort, and X symbols indicate the measurement was from the LCC cohort. Any symbol in black is a GBA mutation/variant carrier. Wilcoxon rank sum test was used for pairwise comparisons to identify groups differing from each other. *P < 0.05, **P < 0.005, ***P < 0.0001; ##P < 0.01.