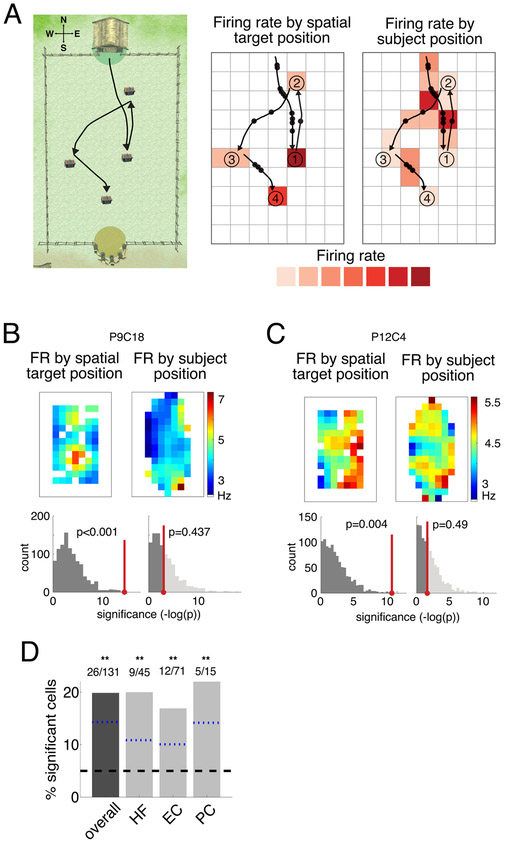
Figure 2: Neural activity related to spatial target position.
A. Analysis framework for binning navigation period neuronal data by subject position and spatial target location, shown for an example trial. Left, overhead view of Treasure Hunt environment with example paths to 4 chests (only one chest is visible at a given time). The NESW coordinates we use are shown in the upper left. Middle, example path spikes binned by spatial target location to calculate firing rate during navigation based on the chest location. Right, same spikes binned by subject position to calculate firing rate on the path. B. Top-left, firing rate map of navigation activity binned by spatial target position for a neuron in the left entorhinal cortex from Patient 9. Black line indicates the perimeter of the traversable virtual environment, and areas that didn’t meet minimum traverse time requirements as described in the STAR Methods are plotted in white. Bottom-left, histogram of p-values from ANOVA (see STAR Methods) assessing spatial target location modulation of firing rate for the observed data (red) versus shuffled data (gray). This cell’s activity is significantly modulated by the spatial target position (permutation-corrected ANOVA, p < 0.001). Top-right, firing rate map for current location. Bottom-right, histogram of p-values from ANOVA assessing current location modulation of firing rate. Neuron is not significantly modulated by subject position (p = 0.43). C. Same as B but for another example neuron in the right entorhinal cortex from Patient 12. Neuron is significantly modulated by spatial target position (p = 0.004) and not subject position (p = 0.49). D. Percentage of significant spatial-target cells by region. Shown for all MTL neurons (“overall”) and also split into HF, EC, and PC. Symbols above the bars indicate p-values from a one-sided binomial test for each proportion, FDR-corrected (**p < 0.01, *p < 0.05, +p < 0.1). The black dashed line represents the 5% false positive rate, and the blue dotted lines are the lower 95% confidence interval from the one-sided binomial test for each bar.
See also Figure S4.

