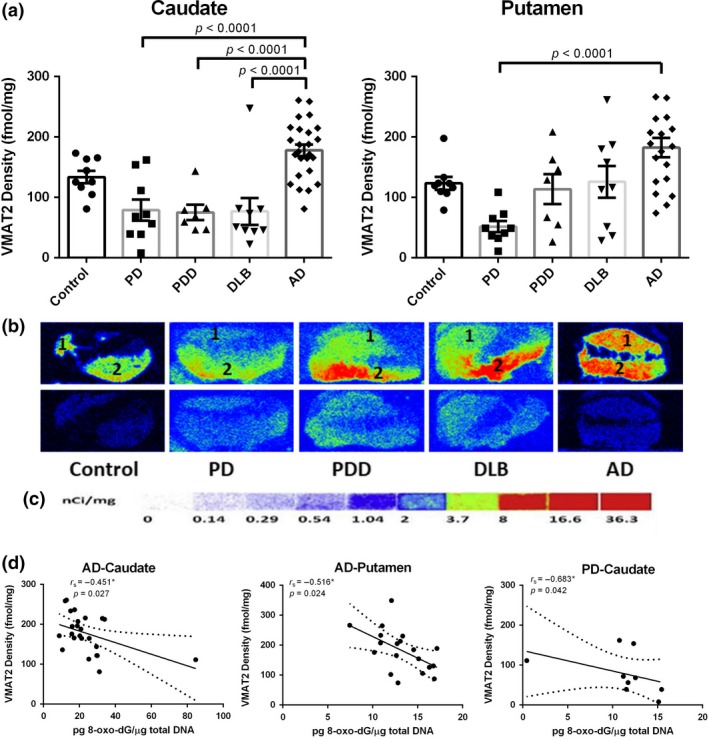
Figure 4.

Quantitative autoradiographic analysis of vesicular monoamine transporter 2 (VMAT2) density in the caudate and putamen from patients with diseases [Parkinson disease (PD): n = 10, Parkinson disease dementia (PDD): n = 7, dementia with Lewy bodies (DLB): n = 10, Alzheimer's disease (AD): n = 26] and age‐matched controls (n = 10). (a) Quantitative analysis of the VMAT2 density (fmol/mg) in the caudate and putamen from subjects. Value shown are means ± SEM. Statistical significances between two disease groups are indicated with brackets and corresponding p‐values (p < 0.0001 were found for PD vs AD, PDD vs AD, and DLB vs AD in the caudate, as well as PD vs AD in the putamen). (b) Autoradiograms show total binding of 4 nmol/L [3H]DTBZ (Panel b top row) and non‐specific binding in the presence of 1 µM S(‐)‐tetrabenazine (Panel b bottom row) in the striatal regions of 5 representative subjects. The numbers 1 and 2 designate the following regions: caudate (1) and putamen (2). (c) [3H]Microscale standards (ranging from 0 to 36.3 nCi/mg) were also counted. (d) Density of VMAT2 as concentration of 8‐oxo‐7,8‐dihydro‐2'‐deoxyguanosine (8‐oxo‐dG) in the caudate and putamen from AD brains (p = 0.027 and p = 0.024, respectively), as well as that in the caudate from PD brains (p = 0.042). r s, the Spearman's rank correlation coefficient.
