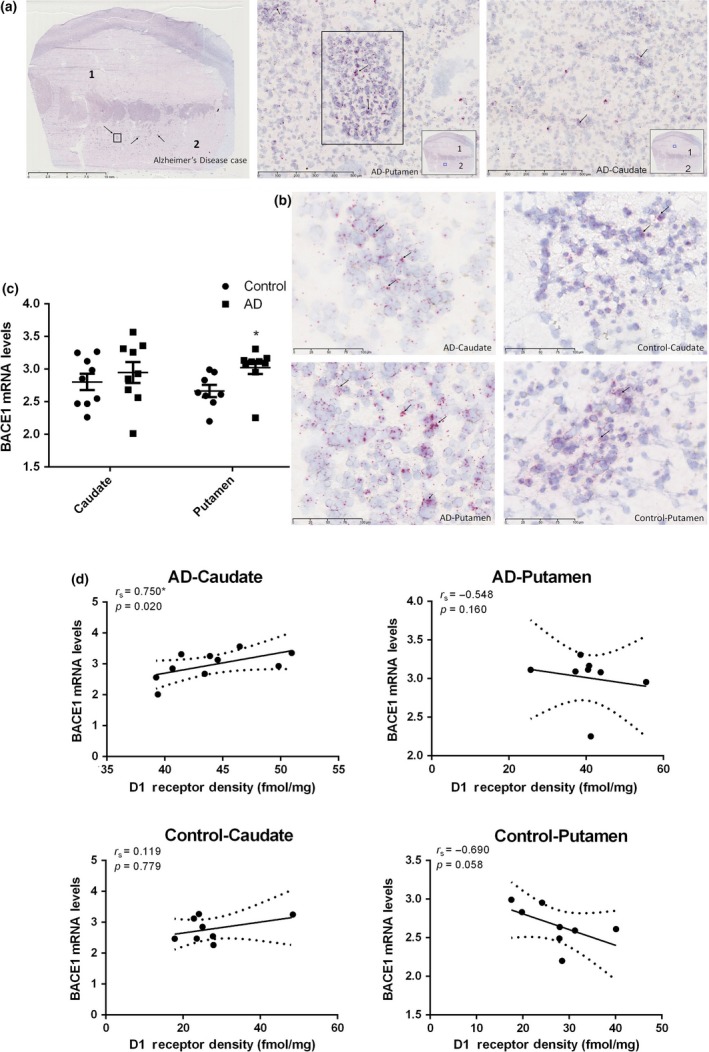
Figure 6.

RNAscope in situ hybridization (ISH) analysis of β‐site APP cleaving enzyme 1 (BACE1) transcriptional expression in the caudate and putamen from patients with Alzheimer's disease (AD) (n = 10) and age‐matched controls (n = 10). (a) RNAscope in situ hybridization (ISH) labeling for BACE1 mRNA in the caudate and putamen from the AD subject included in the previous group of 5 representative subjects. Scale bar in the whole slide section: 10 mm. Scale bar in the high magnification mode β‐amyloid plaque and NFT sections: 500 µm. Rectangle drawn in the whole slide section is magnified to highlight AB plaques and labeled as AD putamen image directly to the right. The numbers 1 and 2 designate the following regions: caudate (1) and putamen (2). (b) Positive cells (red with arrow pointing to them) in the caudate and putamen of AD and control subjects with scale bar: 100 µm. (c) semi‐quantitative regional analysis of ISH signal in region of interest, the signals were quantified as the average red dots count per mm2. Value shown are means ± SEM. T‐test was used. A p value of < 0.05 was considered significant, * indicates p < 0.05 vs. the controls. (d) BACE1 mRNA expression as density of dopamine D1 receptor in the caudate and putamen from patients with AD and age‐matched controls. r s, the Spearman's rank correlation coefficient. The only significant correlation was in the caudate of the AD group (p = 0.02).
