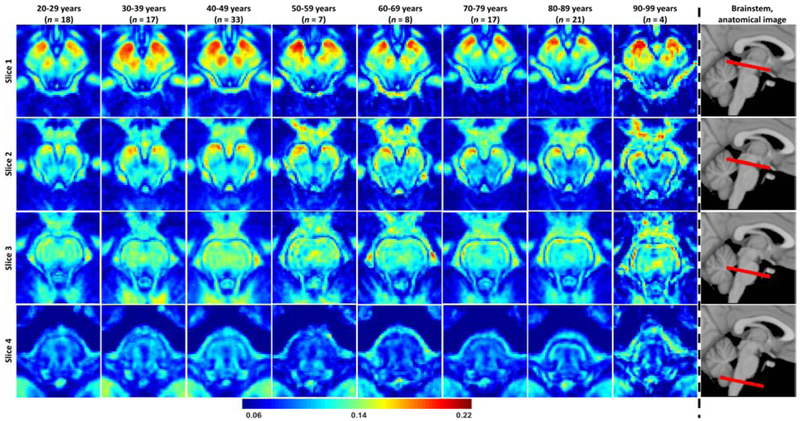
Figure 3: Myelin water fraction (MWF) represented as averaged participant maps calculated over 10-year intervals.
Results are shown for four representative slices covering the main brainstem structures. Slices 1 and 2 are representative axial views of the midbrain while slices 3 and 4 are representative axial views of the pons and medulla, respectively. The red bars on the anatomical images indicate the location of the slices. Visual inspection of MWF maps shows an increase in MWF values from early adulthood through middle age, that is, from 20-29 years through 40-49 years, followed by a more rapid decrease, in several brainstem substructures.

