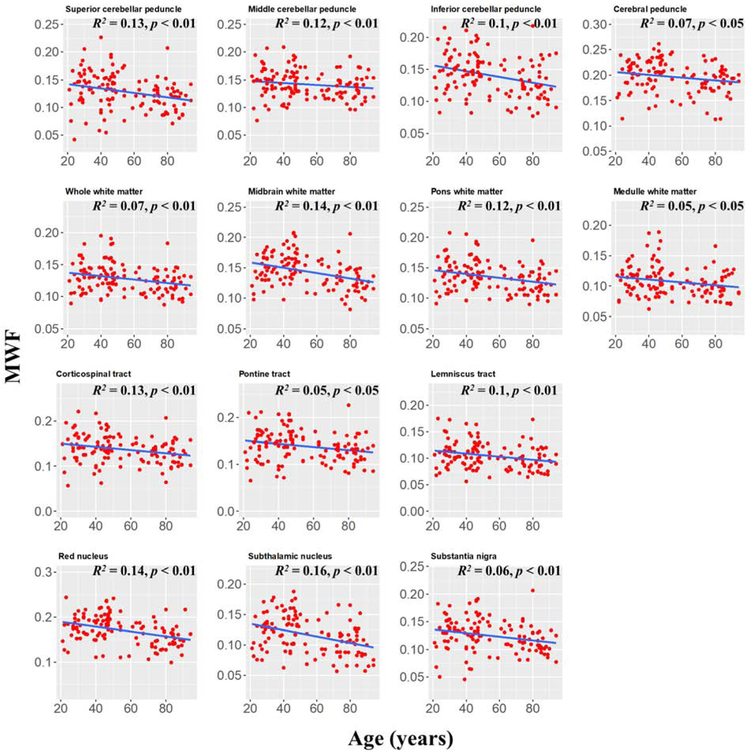
Figure 4: Plots of myelin water fraction (MWF) ROI values as a function of age (N = 125) for white and deep grey matter substructures within the brainstem.
For each region, the coefficient of determination, R2, and the significance of the linear regression model, p, are reported. All regions investigated showed linearly decreasing trends of MWF with age while exhibiting variation in slope.

