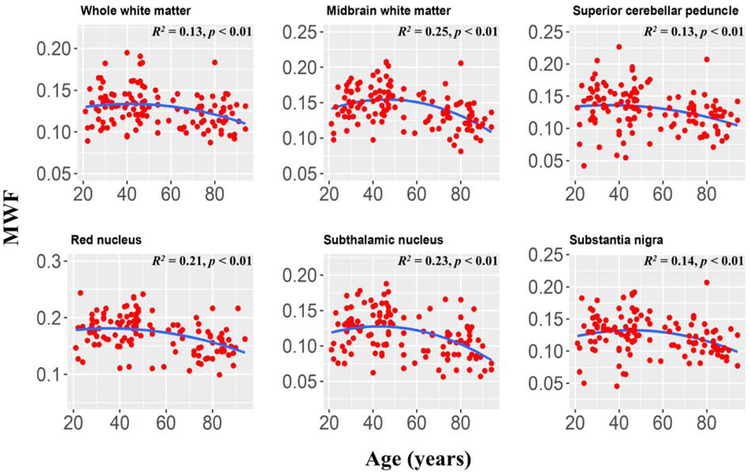
Figure 5: Plots of myelin water fraction (MWF) ROI values as a function of age (N = 125) for six of the substructures also highlighted in Fig. 4, but for which quadratic trends of MWF were significant.
For each region, the coefficient of determination, R2, and the significance of the overall regression model, p, are reported. These selected regions clearly exhibited a quadratic trend of age on MWF, with significant or close to significant p values. This suggests progressive myelination continuing into middle age followed by more rapid myelin loss. We note that similar trends have recently been reported in the cerebrum (7, 21).

