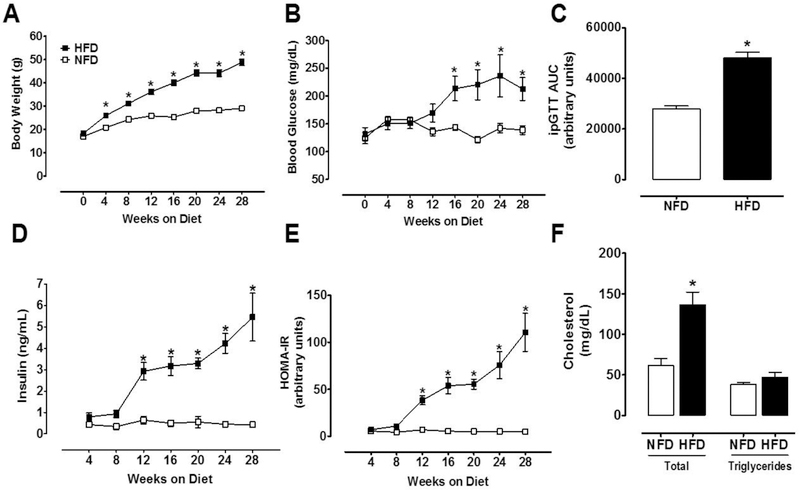
Figure 1. Metabolic phenotype of mice fed a HFD.
After 28 weeks, HFD-fed mice showed marked signs of obesity and T2D as evidenced by (A) Body weight (2-way ANOVA, diet effect: P<0.001), (B) Blood glucose (2-way ANOVA, diet effect: P<0.05), (C) ipGTT (t-test, P<0.001), (D) Plasma insulin (2-way ANOVA, diet effect: P<0.001), (E) HOMA-IR (2-way ANOVA, diet effect: P<0.001), and (F) Plasma total cholesterol (t test P<0.003). NFD, normal fat diet (withe); HFD, high fat diet (black); Data are mean ± SEM.

