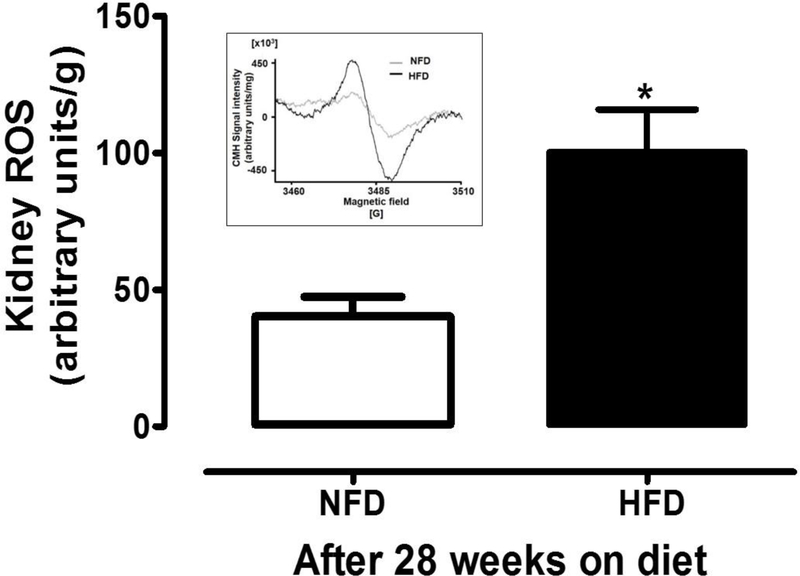
Figure 5. Kidney ROS production measured by ESR spectroscopy in whole kidneys from NFD and HFD mice.
Characteristic ESR spectra of CMH representing samples from HFD and NFD fed animals were shown in upper left insert and the cumulative data represented in the bar graphs. The HFD-T2D mice showed 2.5-fold elevation in ROS production compared to NFD mice. ROS production was normalized to the dry weight of the corresponding kidney samples in grams. NFD: normal fat diet (withe); HFD: high fat diet (black); ROS: reactive oxygen species; ESR: electron spin resonance. Data are mean ± SEM.

