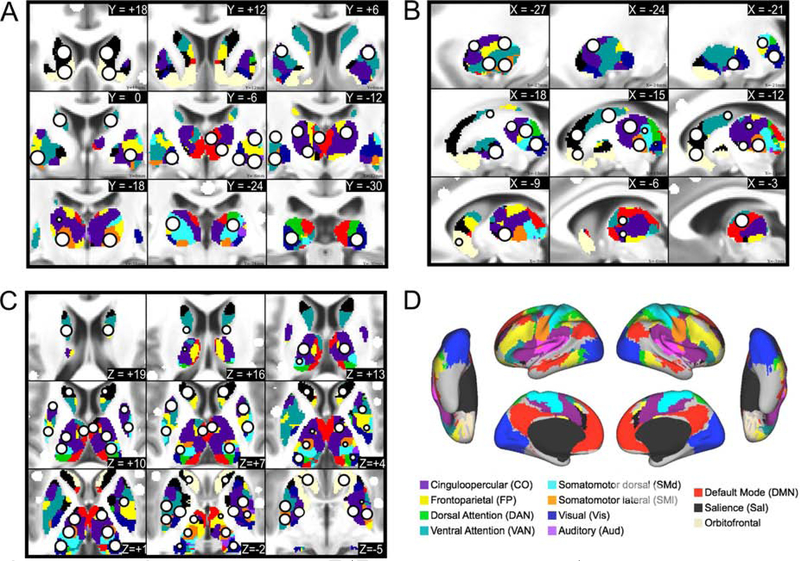
Figure 1: Subcortical ROIs.
The new ROIs (white circle with black outline) are displayed in serial coronal (A), sagittal (B), and axial (C) sections of the thalamus and basal ganglia, with the cortical functional networks for reference (D). The ROIs are overlaid on top of the voxel-wise winner-take-all partitions.

