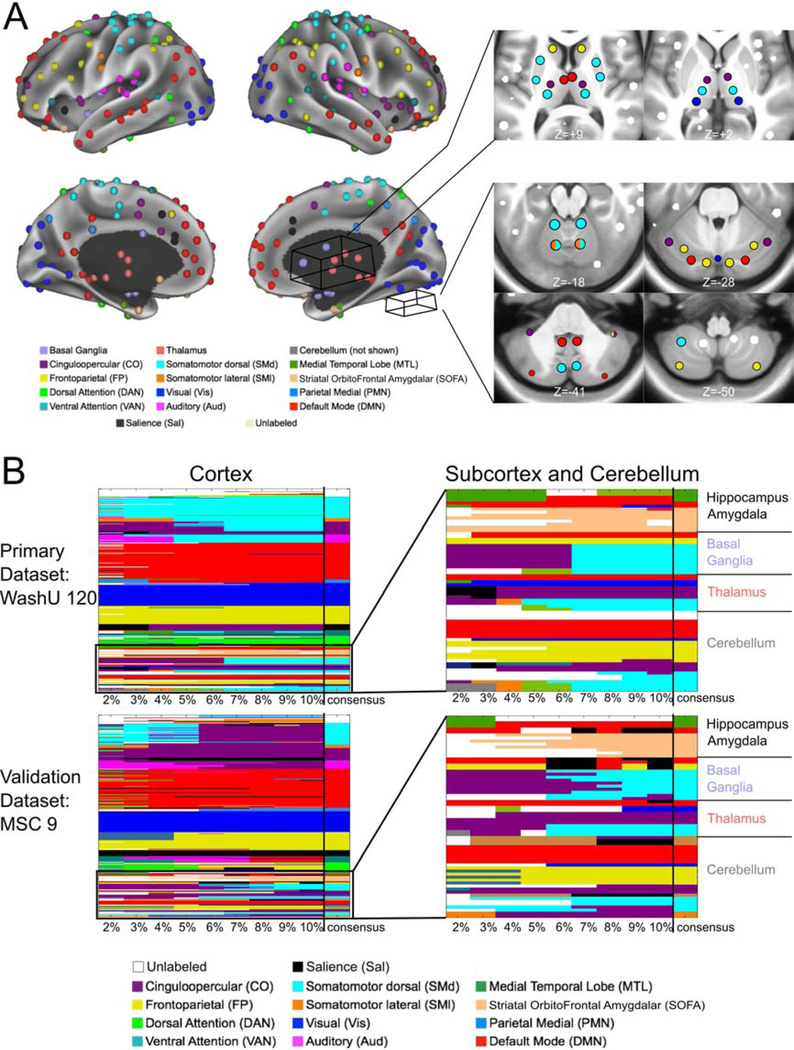
Figure 6: InfoMap-defined functional network communities.
The InfoMap-defined functional network community of each ROI is displayed. (A) Cortical ROIs are shown projected onto the surface of the brain, and some of the non-cortical ROIs are displayed in axial slices to the right of the cortical surface. (B) The matrices represent the functional network assignment of each ROI across all tested edge densities (each column, denoted by the tick marks, represents one edge density), with the consensus functional network community displayed in the last column of each matrix (delineated by the vertical black line). Results are shown for the primary and validation datasets. The matrices on the left represent the cortical ROIs, and the colors correspond to the labels in A. The matrices on the right show zoomed-in results for all noncortical ROIs. Results were highly consistent in the subcortex, cerebellum, amygdala, and hippocampus, with a total of 3 disagreements between datasets (in addition to 3 unlabeled ROIs at the bottom of the cerebellum forming their own “network” in the MSC dataset).

